
Investment analysis is a process of researching and evaluating investment opportunities to determine their potential risks and returns. It is essential for making informed investment decisions, whether an investor is an individual, a business owner, or a financial analyst. By conducting investment analysis, investors can determine the appropriate entry price, the expected time horizon for holding an investment, and the role the investment will play in their overall portfolio. They can also evaluate the potential risks associated with a particular investment opportunity, including market risk, credit risk, and liquidity risk. In short, investment analysis is essential for making informed investment decisions. It helps investors evaluate the suitability of an investment opportunity for their individual needs and goals and determine the potential risks and returns associated with that investment opportunity. Investment analysis is of utmost importance for investors to make informed investment decisions. Here are a few reasons why conducting investment analysis is crucial: By analyzing market trends, financial data, and economic indicators, investors can determine the potential capital gains, dividends, and interest associated with a particular investment opportunity. This information helps investors understand the risks and potential returns before committing to their capital. By analyzing different investment opportunities, investors can determine which ones are suitable for their portfolios based on their individual needs, goals, and risk tolerance. A diversified portfolio helps investors mitigate risks associated with investing in a single asset class, sector, or company. Investment analysis helps investors identify undervalued investments that the market may have overlooked. By analyzing a company's financial statements, industry trends, and management structure, investors can determine its potential value as an investment. This information helps investors identify investment opportunities that are trading at a discount to their intrinsic value, providing them with the potential for significant returns. By analyzing market trends, financial data, and economic indicators, investors can determine how their investments are performing and how they fit into their overall portfolio. This information helps investors make informed decisions about their investments, ensuring that they understand the potential risks and returns associated with each investment opportunity. There are several types of investment analysis, each with its own unique approach and tools. Fundamental analysis involves analyzing the financial statements of a company, management structure, and industry trends to determine its potential value. This approach focuses on the underlying financial health of a company rather than market trends or technical indicators. Some common tools used in fundamental analysis include analyzing financial ratios, such as price-to-earnings ratio and debt-to-equity ratio, and examining industry trends and competitive analysis. For example, when evaluating a stock, an investor may use fundamental analysis to examine a company's financial statements, including its revenue, earnings, and cash flow. Technical analysis involves analyzing market trends, price movements, and technical indicators to predict future performance. Unlike fundamental analysis, which focuses on a company's underlying financial health, technical analysis focuses on market trends and technical indicators. Some common tools used in technical analysis include charts and indicators, such as moving averages and relative strength index (RSI). For example, when evaluating a stock, an investor may use technical analysis to examine charts and indicators to determine if the stock is trending upward or downward. Technical analysis can also help investors determine the best time to buy or sell a particular stock. The top-down approach involves analyzing macroeconomic trends, such as economic indicators and market trends, before focusing on individual investments. This approach begins with analyzing the overall market, then narrows down to specific sectors and industries before evaluating individual investments. For example, when evaluating potential investments in the healthcare industry, an investor may use the top-down approach to analyze overall market trends and economic indicators before focusing on specific healthcare sectors and individual investments. The bottom-up approach involves analyzing individual investments, such as stocks or bonds, before analyzing the overall market or economic trends. This approach focuses on individual investments' financial health and potential returns rather than market trends or economic indicators. For example, when evaluating a potential investment in a specific company, an investor may use the bottom-up approach to analyze the company's financial statements, management structure, and potential returns before considering overall market trends or economic indicators. There are several key factors to consider when conducting investment analysis, including market analysis, risk analysis, and return analysis. Market analysis involves evaluating market trends and economic indicators to determine potential investment opportunities. This process includes examining industry trends, evaluating competitive analysis, and analyzing market demand and supply. Tools commonly used in the market analysis include SWOT analysis, Porter's five forces analysis, and PEST analysis. SWOT analysis examines a company's strengths, weaknesses, opportunities, and threats. Porter's five forces analysis evaluates industry competition, the bargaining power of suppliers and buyers, the threat of new entrants, and the threat of substitutes. The PEST analysis examines the political, economic, social, and technological factors that can impact an investment opportunity. Risk analysis involves evaluating the potential risks of an investment opportunity, including market risk, credit risk, and liquidity risk. Market risk refers to the potential for losses due to market fluctuations, while credit risk refers to the potential for losses due to the failure of a borrower to repay a loan. Liquidity risk refers to the potential for losses due to the inability to sell an investment quickly enough. Investors can use various tools to evaluate potential risks, such as stress testing, scenario analysis, and sensitivity analysis. Stress testing involves evaluating the potential impact of extreme events, such as a financial crisis or economic downturn. Scenario analysis involves evaluating the potential impact of specific scenarios, such as changes in interest rates or commodity prices. Sensitivity analysis involves evaluating the potential impact of changes in specific variables, such as revenue or expenses. Return analysis involves evaluating the potential returns of an investment opportunity, including capital gains, dividends, and interest. This process involves examining historical returns, evaluating potential future returns, and comparing potential returns to other investment opportunities. To evaluate potential returns, investors can use a variety of tools, such as discounted cash flow analysis and internal rate of return analysis. Discounted cash flow analysis involves evaluating an investment's potential future cash flows and discounting them to their present value. Internal rate of return analysis involves evaluating the potential return of an investment based on its cash inflows and outflows. One real-world example of investment analysis involves evaluating a potential investment in a publicly-traded company. In this scenario, an investor is considering investing in a recent public technology company. To conduct an investment analysis, the investor would first examine the company's financial statements, including its revenue, earnings, and cash flow. In addition, the investor would analyze market trends and economic indicators to determine potential risks and returns. Based on the investment analysis results, the investor may decide to invest in the company or choose to invest in another opportunity that better aligns with their individual needs and goals. Several investment analysis tools are available to investors, including financial ratios and investment software. Financial ratios are commonly used in investment analysis to evaluate a company's financial health and potential returns. Some common financial ratios include the price-to-earnings ratio, debt-to-equity ratio, and return on investment ratio. Price-to-earnings ratio (P/E ratio) is calculated by dividing a company's stock price by its earnings per share. Debt-to-equity ratio is calculated by dividing a company's total debt by its total equity. Return on investment (ROI) ratio is calculated by dividing a company's net profit by its total assets. Investment software is a powerful tool for conducting investment analysis. Popular investment software includes Morningstar and Thomson Reuters Eikon, which allow investors to analyze financial data, evaluate potential investments, and track portfolio performance. Investment analysis is a critical process for making informed investment decisions. By analyzing market trends, potential risks, and potential returns, investors can evaluate the suitability of an investment opportunity for their individual needs and goals. Fundamental and technical analysis and the top-down and bottom-up approaches are all valuable tools for conducting investment analysis. Factors such as market, risk, and return analysis must also be considered when evaluating potential investments. Investment analysis tools such as financial ratios and investment software can help investors conduct more detailed and accurate analyses. When evaluating potential investments, investors must consider their individual goals, risk tolerance, and financial situation. By utilizing investment analysis tools and approaches, investors can better evaluate investment opportunities and make decisions that align with their individual needs and goals. It is always advisable for investors who are not comfortable doing investment analysis on their own to seek advice from an investment advisor or a wealth management professional.What Is Investment Analysis?
Importance of Investment Analysis
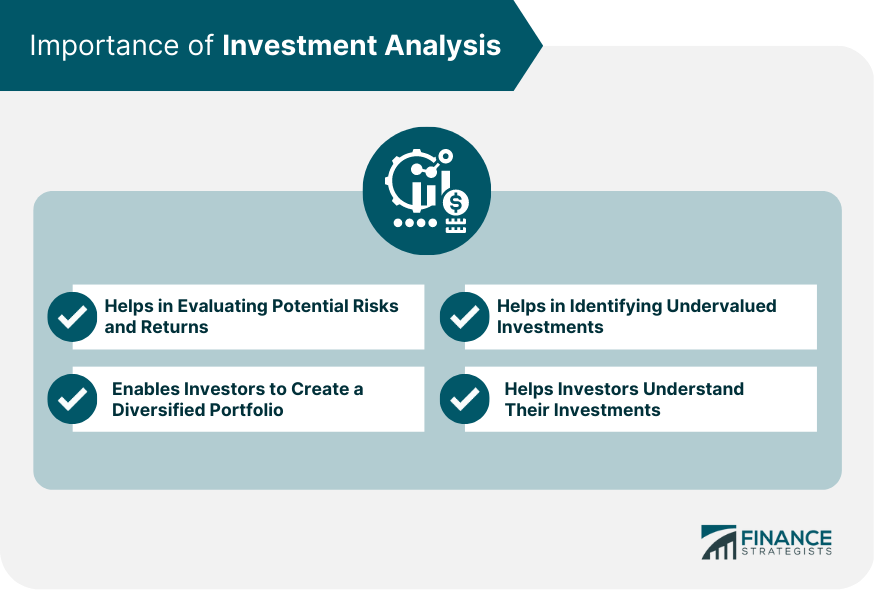
Helps in Evaluating Potential Risks and Returns
Enables Investors to Create a Diversified Portfolio
Helps in Identifying Undervalued Investments
Helps Investors Understand Their Investments
Types of Investment Analysis
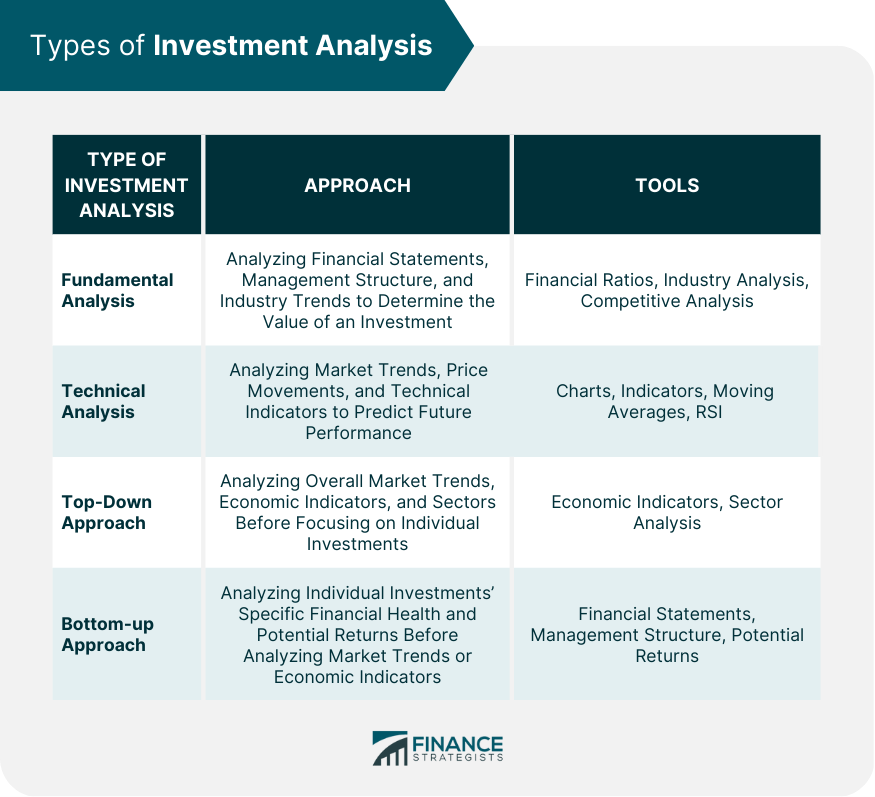
Fundamental Analysis
Technical Analysis
Top-Down Approach
Bottom-up Approach
Factors Considered in Investment Analysis
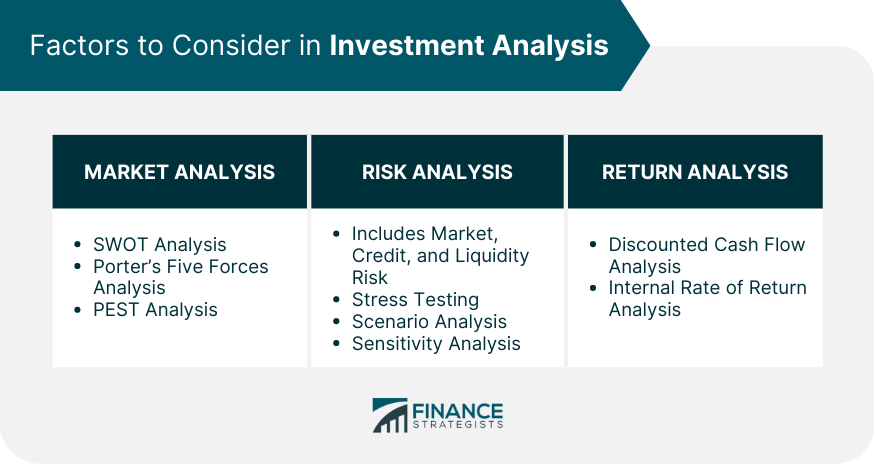
Market Analysis
Risk Analysis
Return Analysis
Real-World Example of Investment Analysis
Investment Analysis Tools
Financial Ratios
Investment Software
Final Thoughts
Investment Analysis FAQs
Investment analysis is a process of researching and evaluating investment opportunities to determine their potential risks and returns. It involves analyzing market trends, financial data, and economic indicators to assess the suitability of an investment opportunity for an investor's individual needs and goals.
Investment analysis is critical for making informed investment decisions. It helps investors evaluate the potential risks and returns associated with different investment opportunities, and determine the appropriate entry price, expected time horizon, and the role an investment will play in their overall portfolio. It also helps investors create a diversified portfolio, identify undervalued investments, and understand the potential risks and returns associated with each investment opportunity.
There are several types of investment analysis, including fundamental analysis, technical analysis, top-down approach, and bottom-up approach. Fundamental analysis involves analyzing the financial health of a company, while technical analysis focuses on market trends and technical indicators. The top-down approach involves analyzing macroeconomic trends before focusing on individual investments, while the bottom-up approach involves analyzing individual investments' financial health and potential returns.
Investors should consider several key factors when conducting investment analysis, including market analysis, risk analysis, and return analysis. Market analysis involves evaluating market trends and economic indicators, while risk analysis involves evaluating potential risks, including market risk, credit risk, and liquidity risk. Return analysis involves evaluating potential returns, including capital gains, dividends, and interest.
Investment analysis tools available to investors include financial ratios such as price-to-earnings ratio, debt-to-equity ratio, and return on investment ratio. Investment software such as Morningstar and Thomson Reuters Eikon can also help investors analyze financial data, evaluate potential investments, and track portfolio performance. Other tools include stress testing, scenario analysis, sensitivity analysis, discounted cash flow analysis, and internal rate of return analysis.
True Tamplin is a published author, public speaker, CEO of UpDigital, and founder of Finance Strategists.
True is a Certified Educator in Personal Finance (CEPF®), author of The Handy Financial Ratios Guide, a member of the Society for Advancing Business Editing and Writing, contributes to his financial education site, Finance Strategists, and has spoken to various financial communities such as the CFA Institute, as well as university students like his Alma mater, Biola University, where he received a bachelor of science in business and data analytics.
To learn more about True, visit his personal website or view his author profiles on Amazon, Nasdaq and Forbes.


