
A bullish engulfing pattern is a graphical representation of a certain price movement in technical analysis that can signal a potential market reversal from a bearish trend to a bullish trend. The pattern, typically identified on a candlestick chart, consists of a smaller bearish (downward moving) candle followed by a larger bullish (upward moving) candle that 'engulfs' the previous candle. It is a potent symbol in the realm of trading, serving as a beacon to traders around the world. The bullish engulfing pattern holds immense importance in trading due to its ability to predict a potential market reversal. Traders often look for such patterns to time their market entries and exits. However, like any other trading signal, the bullish engulfing pattern isn't a guarantee of future price movement. Instead, it's a signal, or hint, that traders can use in conjunction with other technical indicators to make more informed trading decisions. Before understanding the bullish engulfing pattern, it's crucial to understand candlestick charts. A single candlestick represents four significant points in a specific trading period: the opening price, the closing price, the highest price, and the lowest price. The body (or the rectangular part) of the candlestick represents the opening and closing prices. If the closing price is higher than the opening price, the body is usually unfilled or white (representing a bullish candle). Conversely, if the opening price is higher than the closing price, the body is typically filled or black (representing a bearish candle). The color and formation of the candlestick can provide traders with valuable information about market sentiment. A bullish candle, for instance, suggests buying pressure, while a bearish candle indicates selling pressure. The candlestick's length or 'height,' represented by its body and shadows (the lines extending from the body), indicates the range of price movement and can hint at the strength of the underlying market sentiment. The bullish engulfing pattern begins with a bearish candle. This is a candle where the closing price is lower than the opening price. The size of this candle can vary, but it's typically smaller compared to the following candle in the pattern. The second candle in a bullish engulfing pattern is a bullish candle. Its closing price is higher than its opening price. Importantly, the body of this bullish candle fully engulfs or covers the body of the preceding bearish candle. This visually represents a strong shift in market sentiment from bearish to bullish. The placement of the bullish engulfing pattern within the broader trend is critical in determining its validity. A true bullish engulfing pattern typically emerges at the end of a downtrend or during a period of market consolidation. This context is crucial because the pattern signals a possible trend reversal, turning from bearish to bullish. When a bullish engulfing pattern emerges at the end of a downtrend, it serves as a potential indicator that the trend may be about to reverse. After a sustained period of falling prices, the emergence of this pattern suggests that buying pressure may be starting to outpace selling pressure, leading to a potential rise in price. During a period of market consolidation, prices move sideways within a relatively narrow range. If a bullish engulfing pattern appears during this time, it could indicate a break from this consolidation period and a move into a bullish trend. The size of the candles within the bullish engulfing pattern plays a pivotal role in the strength of the signal. The second candle, the bullish one, should be significantly larger than the first bearish candle, thereby 'engulfing' it. The size of the bullish candle represents the strength of the buying pressure. A larger bullish candle implies that the buyers have significantly overcome the sellers, marking a strong bullish reversal. It's crucial to remember that the bullish candle's body must engulf the bearish candle's body. The wicks, or shadows, of the candles, which represent price extremes during the candle's formation, are not a necessity to be engulfed. However, if the bullish candle also engulfs the shadows of the bearish candle, it may suggest an even stronger bullish sentiment. The bullish engulfing pattern is typically interpreted as a potential buy signal by traders. The pattern suggests that bulls have overcome the bears, leading to a potential upward price movement. However, it's critical to consider this pattern as a part of a broader analysis strategy rather than as a standalone indicator. As mentioned, the bullish engulfing pattern often signals a possible trend reversal from bearish to bullish. This occurs because the pattern represents a shift in market sentiment. After a period of selling pressure, as indicated by the bearish candle, the buying pressure takes over, creating a bullish candle that engulfs the bearish one. The bullish engulfing pattern can have a profound impact on market sentiment. Its appearance might prompt traders to enter long positions or exit short positions, anticipating a price increase. This can create further upward price movement, causing a positive feedback loop. While the bullish engulfing pattern can be a valuable tool, it also carries certain risks that traders should consider. These risks include: False breakouts can occur when the bullish engulfing pattern forms, leading traders to believe in a trend reversal, but the price subsequently resumes its original downtrend. This can result in trapped traders who enter positions based on the pattern, leading to losses. Even when the bullish engulfing pattern successfully signals a trend reversal, there is a risk of incomplete reversals. In such cases, the price may temporarily rise but fail to sustain a long-term bullish trend. Traders should be cautious and manage their positions accordingly to avoid potential losses. Sometimes, the bullish engulfing pattern may take time to confirm its validity, leading to delayed entry or missed opportunities. Traders who rely solely on the pattern might enter trades too late or miss out on potential profitable positions. Traders who solely rely on the bullish engulfing pattern may fall into the trap of over-reliance on a single indicator. This can lead to a lack of flexibility in trading strategies and may overlook other crucial market signals. Diversifying analysis methods and considering multiple indicators can help mitigate this risk. Traders can use the bullish engulfing pattern as an entry signal for buying a security. The formation of the pattern suggests that the bears are losing control and the bulls are starting to dominate. This could indicate a potential upward movement in price, providing a good opportunity to buy. Stop-loss orders can also be positioned based on the bullish engulfing pattern. A common approach is to set a stop-loss order just below the low of the bullish candle in the pattern. This way, if the price unexpectedly drops, the position will be automatically closed to limit the loss. Profit targets can be set using the pattern as well. Traders may aim for a target that's equal to the size of the bullish engulfing candle or even larger, depending on their risk tolerance and market volatility. The bullish engulfing pattern can be paired with volume indicators for a stronger signal. A high trading volume during the formation of the bullish candle can confirm the bullish reversal. Moving averages can help identify the overall trend. If a bullish engulfing pattern forms near a significant moving average, it may provide further confirmation of the bullish reversal. RSI can help identify overbought or oversold conditions. A bullish engulfing pattern combined with an oversold RSI can strengthen the bullish reversal signal. In technical analysis, the bullish engulfing pattern stands as a vital tool for traders, signaling a potential trend reversal from bearish to bullish. This pattern, which is identifiable on a candlestick chart, comprises a smaller bearish candle followed by a larger bullish candle that entirely 'engulfs' the former. It marks a critical shift in the market dynamics, indicating that the buying pressure has overcome the selling pressure. By learning how to identify this pattern and interpret its implications, traders can seize opportunities and potentially enhance their trading outcomes. However, the importance of complementing this tool with other technical indicators cannot be overstated. While the bullish engulfing pattern can provide invaluable insights, it is most effective when integrated within a broader analytical framework that includes volume indicators, moving averages, and the Relative Strength Index (RSI), among others. It is equally critical to acknowledge the inherent risk associated with trading and to employ robust risk management strategies. These can involve setting stop-loss orders based on the pattern, which limit potential losses should the price move unfavorably. Ultimately, understanding and applying the bullish engulfing pattern effectively calls for knowledge, practice, and strategic acumen. For those seeking to bolster their financial growth and secure their assets, professional advice, such as wealth management services, can be invaluable. With expert guidance, traders can navigate the complex world of trading with more confidence and make more informed decisions to achieve their financial goals.What Is a Bullish Engulfing Pattern?
Mechanics of a Bullish Engulfing Pattern
Candlestick Charts
Structure of a Bullish Engulfing Pattern
Bearish (Down) Candle
Bullish (Up) Candle
Identifying the Bullish Engulfing Pattern
Signals From the End of a Downtrend
Pattern Emergence During Consolidation
Size of the Candles in the Bullish Engulfing Pattern
Importance of Bullish Candle Size
Shadows and Wicks Consideration
Significance of the Bullish Engulfing Pattern
Interpretation
Sign of Reversal
Impact on Market Sentiment
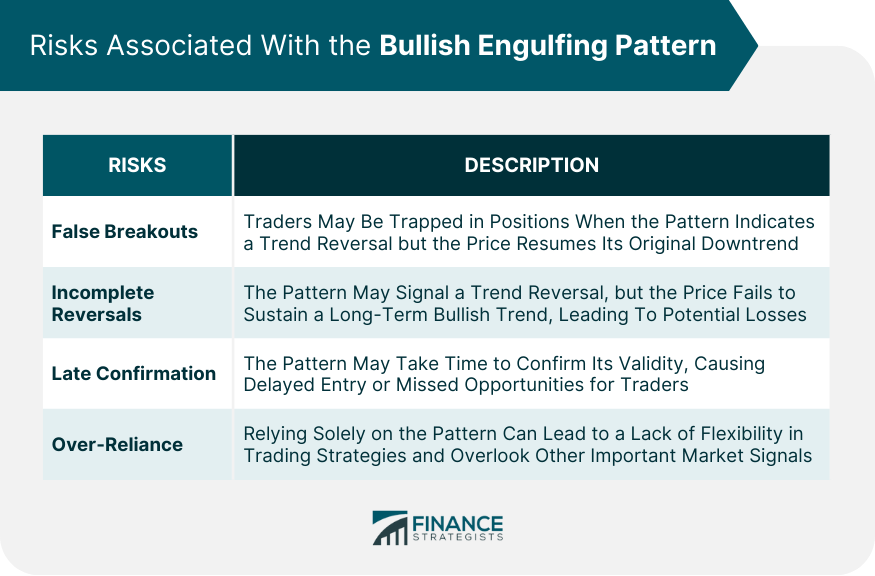
Risks Associated With the Bullish Engulfing Pattern
False Breakouts
Incomplete Reversals
Late Confirmation
Over-Reliance
Bullish Engulfing Pattern in Trading Strategy
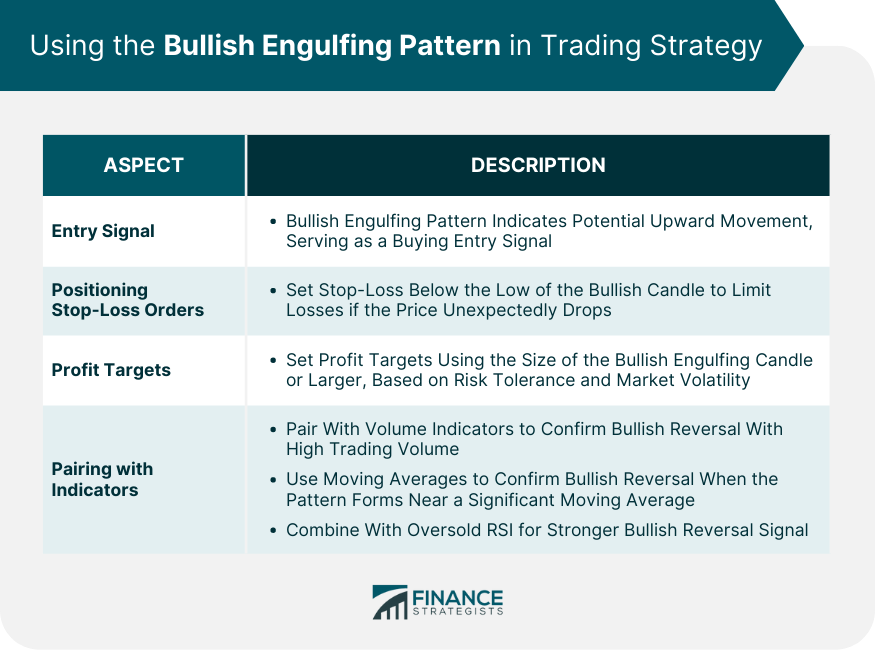
As an Entry Signal
Positioning Stop-Loss Orders
Profit Targets
Pairing With Other Technical Indicators
Volume Indicators
Moving Averages
Relative Strength Index (RSI)
Final Thoughts
Bullish Engulfing Pattern FAQs
A bullish engulfing pattern is a candlestick pattern that suggests a potential market reversal from a bearish to a bullish trend.
The pattern consists of a smaller bearish candle followed by a larger bullish candle that 'engulfs' the previous candle.
The pattern is typically seen as a buy signal, suggesting that the price may begin to rise.
While it's a powerful pattern, it's best used in conjunction with other technical indicators to make more informed trading decisions.
No technical analysis pattern is 100% reliable, but the bullish engulfing pattern is a widely recognized and used indicator of potential bullish reversals.
True Tamplin is a published author, public speaker, CEO of UpDigital, and founder of Finance Strategists.
True is a Certified Educator in Personal Finance (CEPF®), author of The Handy Financial Ratios Guide, a member of the Society for Advancing Business Editing and Writing, contributes to his financial education site, Finance Strategists, and has spoken to various financial communities such as the CFA Institute, as well as university students like his Alma mater, Biola University, where he received a bachelor of science in business and data analytics.
To learn more about True, visit his personal website or view his author profiles on Amazon, Nasdaq and Forbes.


