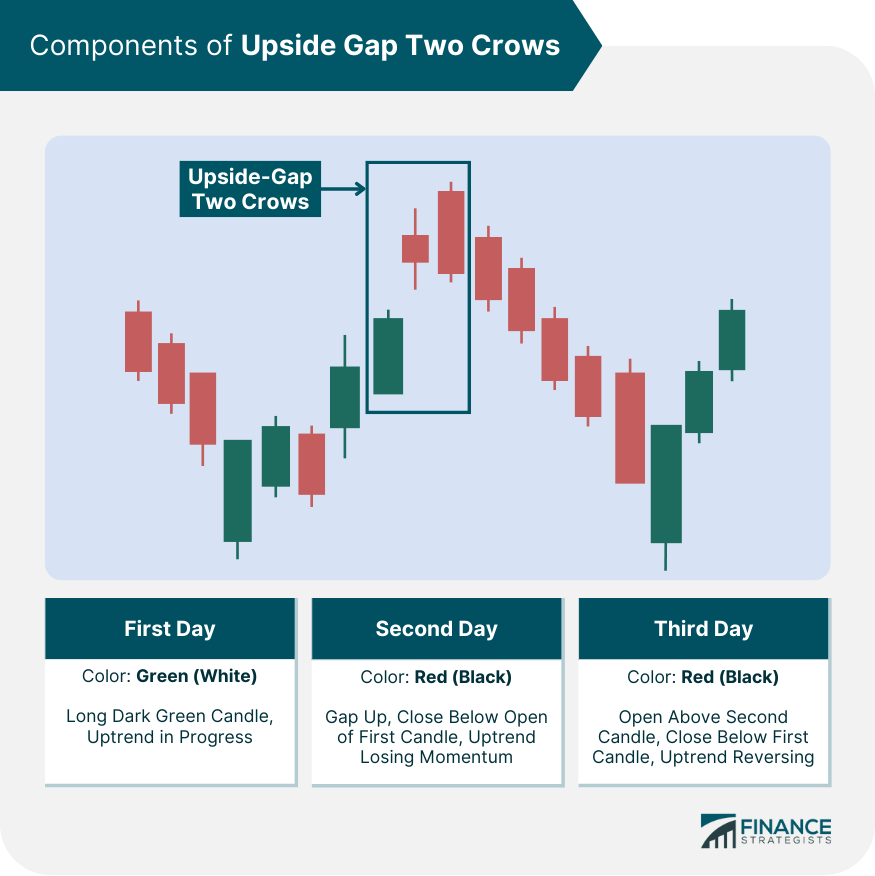
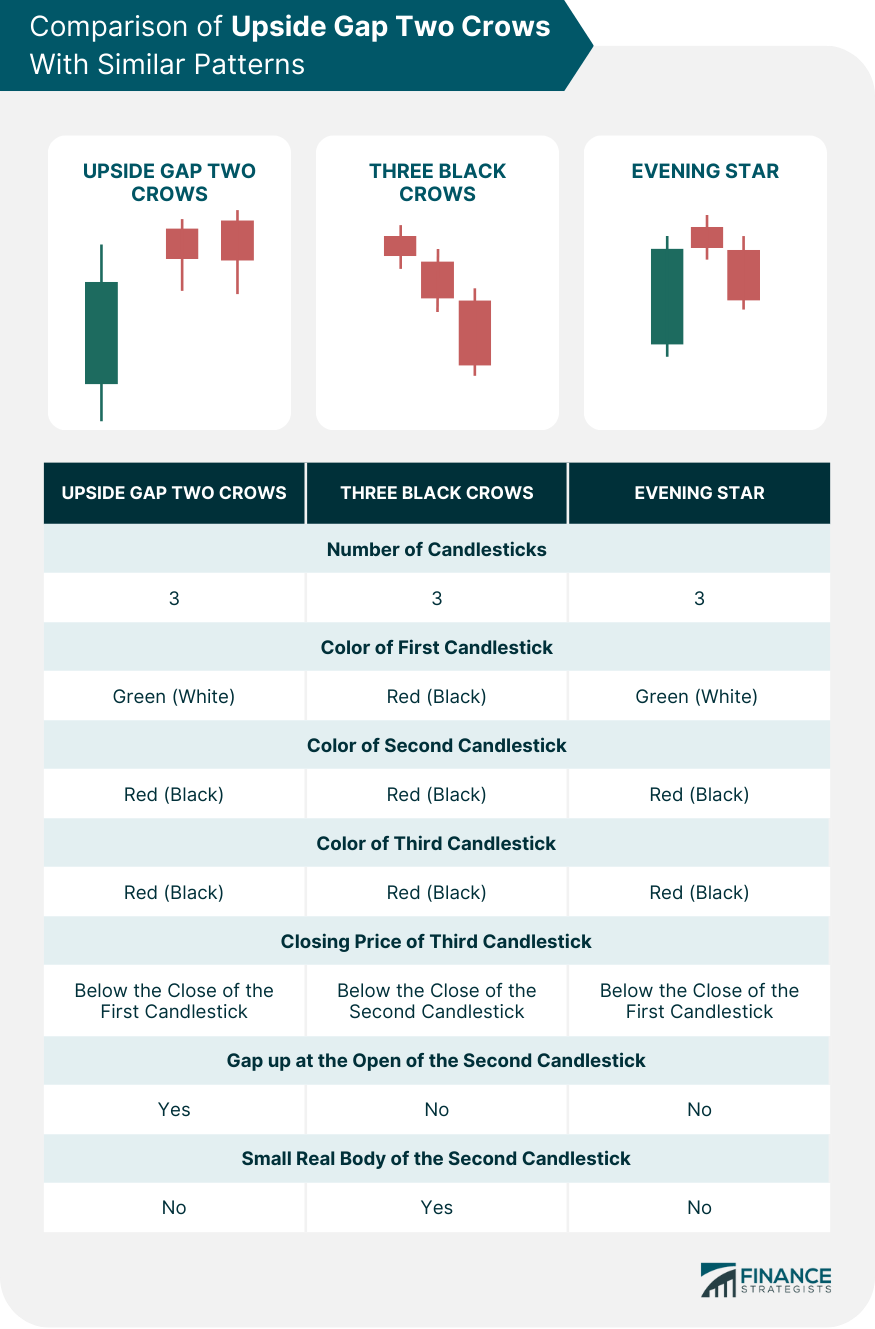
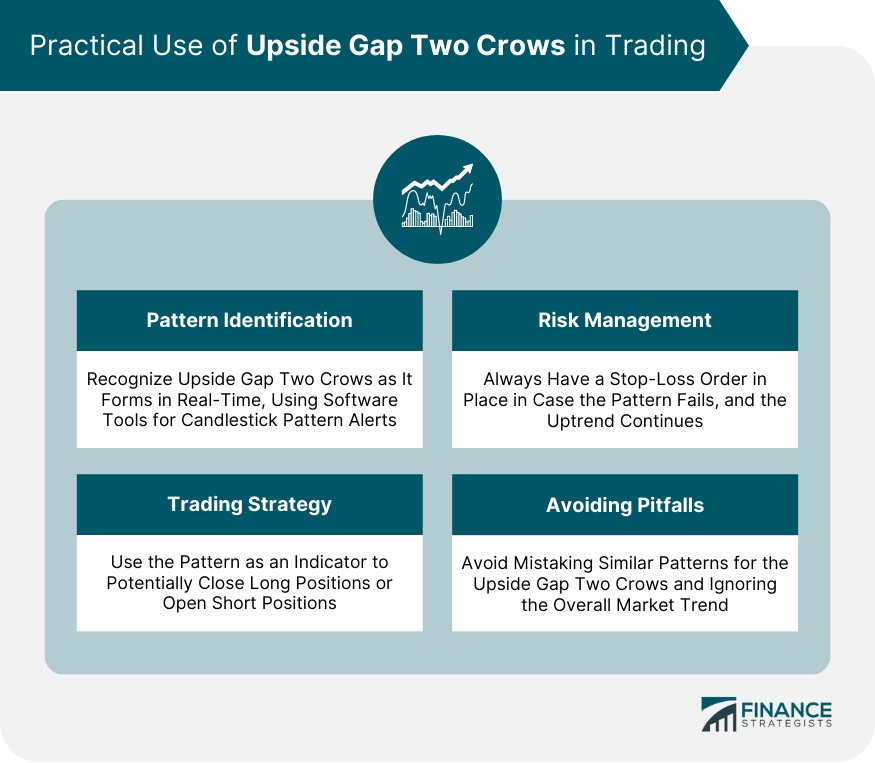
Upside Gap Two Crows is a bearish reversal candlestick pattern used in the technical analysis of stock price charts. This three-day pattern begins with a long bullish candle, followed by a gap up and a small bearish candle, and ends with another bearish candle that closes within the body of the first day's candle but above its close. The purpose of this pattern is to indicate a potential trend reversal from bullish to bearish. It's useful for traders and investors to predict possible future price movements and make informed decisions. The Upside Gap Two Crows pattern significantly impacts readers by alerting them to a potential shift in market sentiment and suggesting caution or potential selling opportunities. Within the context of broader market trends, its occurrence can suggest that bullish momentum is waning, and a downtrend could soon emerge. The Upside Gap Two Crows pattern is a bearish reversal pattern that occurs in an uptrend. It consists of three candlesticks: A green (white) candlestick with a long real body. This indicates that the uptrend is in progress and that buyers are in control. A red (black) candlestick gaps up at the open and closes below the open of the first candle. This is the first sign that the uptrend may be losing momentum. A red (black) candlestick that opens above the open of the second candle but closes below the close of the first candle. This confirms that the uptrend is indeed reversing and that a bearish trend may be in the making. The Upside Gap Two Crows pattern is a relatively reliable indicator of a bearish reversal, but it is important to remember that no single pattern is 100% accurate. It is always best to use multiple technical indicators to confirm a trade signal. The interpretation of the Upside Gap Two Crows pattern is essentially about spotting a potential shift in market sentiment. Bearish reversal implies that after a period of rising prices, the market sentiment may be changing, with prices potentially heading downward. The Upside Gap Two Crows are one of the patterns that signal such a reversal. The emergence of this pattern suggests that bears are gaining control after a period of bullish dominance. Traders may take this as a signal to close long positions or even open short positions. The Upside Gap Two Crows pattern is more significant when it forms after a prolonged or sharp uptrend. The dramatic shift from strong bullish to bearish sentiment provides a more compelling reversal signal. Despite its unique features, the Upside Gap Two Crows pattern can often be mistaken for similar patterns. Both patterns are bearish reversal signals, but their formation differs. Three Black Crows consist of three black candlesticks with consecutively lower closes. In contrast, Upside Gap Two Crows start with a white candlestick and have two black candlesticks, the last of which closes within the range of the first day’s candlestick. The Evening Star is another bearish reversal pattern that resembles the Upside Gap Two Crows. However, the second day of the Evening Star has a small real body (the range between open and close), unlike the second day's black candlestick in the Upside Gap Two Crows. Recognizing and correctly interpreting the Upside Gap Two Crows can be highly beneficial for traders. Identifying the pattern as it forms requires vigilance and an understanding of candlestick patterns. Traders can use software that provides real-time charting tools and alerts for such patterns. Upon recognizing the Upside Gap Two Crows, traders might consider closing long positions or entering a short position. However, it's essential to have a stop-loss order in place if the pattern fails and the uptrend continues. Incorrectly identifying the Upside of Gap Two Crows or ignoring the overall market trend can lead to potential trading mistakes. Traders need to ensure that they are not mistaking similar patterns for the Upside Gap Two Crows. Like all technical analysis tools, the Upside Gap Two Crows pattern has its criticisms and limitations. To improve accuracy, it's often advised to wait for confirmatory signals, such as a further decline in price or other technical indicators signaling a bearish trend. Some critics argue that traders can often misinterpret or overemphasize the pattern, leading to costly trading errors. It's crucial to keep in mind that no pattern can predict market movements with 100% accuracy. The Upside Gap Two Crows is a vital bearish reversal candlestick pattern, offering traders significant insights into potential shifts in market sentiment. Comprising three specific candlesticks, its occurrence suggests a potential downtrend after a period of bullish dominance. This pattern's recognition is crucial in decision-making, prompting traders to possibly close long positions or initiate short positions. Volume plays a critical role in confirming this pattern, and tools that provide real-time charting and alerts can aid in its identification. Comparatively, the Upside Gap Two Crows pattern bears resemblance but is distinct from the Three Black Crows and Evening Star patterns. Despite its utility, traders must watch out for potential misinterpretations and always seek confirmatory signals. This pattern serves as a powerful tool in the trader's arsenal but should always be employed alongside other indicators and in consideration of the broader market context.Upside Gap Two Crows Overview
Components of Upside Gap Two Crows
First Day
Second Day
Third Day

Interpreting the Upside Gap Two Crows
Understanding Bearish Reversal
Potential Market Implications
Context of the Pattern Within the Trend
Comparison With Similar Patterns
Difference Between Upside Gap Two Crows and Three Black Crows
Upside Gap Two Crows Versus Evening Star

Practical Use of Upside Gap Two Crows in Trading
Identifying the Pattern in Real-Time
Trading Strategy and Risk Management
Potential Pitfalls and Misinterpretations

Criticisms and Limitations of Upside Gap Two Crows
Importance of Confirmatory Signals
Potential Misinterpretations and Errors
Bottom Line
Upside Gap Two Crows FAQs
The Upside Gap Two Crows is a three-day bearish reversal pattern found in candlestick charting. It is characterized by a white candlestick on day one, followed by two black candlesticks that open with a gap up from the previous day but close lower. The final black candlestick closes within the range of the first day's white candlestick.
Traders may use the Upside Gap Two Crows as an indicator to close long positions or open short positions, anticipating a potential market downturn. However, it's crucial to use this pattern in conjunction with other market indicators and risk management strategies, as it's not always accurate.
Volume plays a key role in confirming the Upside Gap Two Crows pattern. A spike in trading volume on the third day of the pattern can strengthen the validity of this bearish reversal signal.
While both are bearish reversal patterns, their formations are different. The Three Black Crows consist of three consecutive black candlesticks with lower closes. In contrast, the Upside Gap Two Crows begin with a white candlestick followed by two black candlesticks, the last of which closes within the range of the first day's white candlestick.
Potential pitfalls include misidentifying the Upside Gap Two Crows pattern for another, failing to consider the overall market trend, or over-relying on the pattern without seeking confirmatory signals from other market indicators. Remember, no single pattern can predict market movements with 100% accuracy.
True Tamplin is a published author, public speaker, CEO of UpDigital, and founder of Finance Strategists.
True is a Certified Educator in Personal Finance (CEPF®), author of The Handy Financial Ratios Guide, a member of the Society for Advancing Business Editing and Writing, contributes to his financial education site, Finance Strategists, and has spoken to various financial communities such as the CFA Institute, as well as university students like his Alma mater, Biola University, where he received a bachelor of science in business and data analytics.
To learn more about True, visit his personal website or view his author profiles on Amazon, Nasdaq and Forbes.


