
Market breadth is a fundamental concept in financial analysis that assesses the extent of participation in market movements, assisting in identifying whether these movements are widespread and likely to persist or dominated by a few stocks and thus prone to reversal. This technique enriches traditional price data, revealing potential market trends and reversals while providing a comprehensive understanding of market dynamics and health. This additional layer of analysis can inform smarter investment decisions. As a part of technical analysis, market breadth offers a macro view of market shifts by quantifying the number of stocks involved in a movement, supplementing standard price analysis. Analysts often utilize market breadth to corroborate trends discovered in other technical analyses, making it a critical element of a comprehensive market analysis approach. Interpreting breadth indicators involves understanding the overall market sentiment they express. When more stocks are advancing than declining (positive market breadth), it's often a bullish signal, while the reverse situation (negative market breadth) can signal bearish market sentiment. A divergence between the market's direction and a breadth indicator can signal a potential market reversal. Market breadth divergence occurs when a breadth indicator's direction diverges from the market's direction. For example, if the market continues to rise while breadth indicators fall, this divergence can suggest a weakening trend and potential market reversal. Such divergence scenarios provide valuable signals to investors and traders, indicating that a change in market direction is imminent. Breadth momentum refers to the strength of the underlying trend reflected in market breadth data. A rising breadth momentum often signals strong participation and hence a strong trend, while a falling breadth momentum may suggest a weakening trend. An essential component of market breadth is the number of advancing (rising) and declining (falling) issues, referring to the total number of stocks that have increased or decreased in price. Analysts can compare these numbers to determine whether bullish or bearish sentiment drives the market. In addition to tracking the number of issues, market breadth also considers the volume of shares traded in advancing and declining issues. Volume data adds weight to the price changes, offering a more nuanced perspective on market sentiment. Another component of market breadth is the comparison of stocks hitting new 52-week highs versus those touching new 52-week lows. This data provides a long-term view of market strength or weakness, contributing to a comprehensive understanding of market breadth. One of the primary market breadth indicators is the Advance/Decline Line, which plots the difference between the number of advancing and declining issues over time. This line helps identify if the broad participation of stocks supports a market trend. The Advance/Decline Volume Line uses the same principles as the A/D Line but incorporates the volume of shares traded. It provides a similar function but with an added layer of depth, taking into account the number of stocks moving and the intensity of those moves. The High-Low Index is a breadth indicator focusing on the number of stocks hitting new highs versus new lows. By plotting this data over time, analysts can identify potential market tops and bottoms based on the divergence between this index and the market price. The Breadth Thrust Indicator is a momentum indicator that aims to identify periods of extraordinary market breadth, potentially signaling the start of a significant market trend. It is calculated based on the number of advancing issues over the total number of issues. The market breadth and market sentiment are tightly correlated. Market breadth data, including advancing/declining issues and volumes, new highs and lows, provide a direct measure of market participants' collective actions, reflecting the prevailing market sentiment. When market breadth is positive, it signals bullish sentiment; when negative, it suggests bearish sentiment. By revealing broad participation in a market trend, breadth indicators help predict market sentiment. For example, if the Advance/Decline Line rises, it signals broad participation in a bullish trend, hence positive market sentiment. Conversely, a falling Advance/Decline Line suggests widespread selling and negative sentiment. Market breadth indicators can aid in market timing decisions by providing early warning signs of potential market tops or bottoms. For instance, if a breadth indicator shows a divergence from the market trend, it might be an early signal that the trend is losing strength, and a reversal may be impending. This can provide valuable information to time entry or exit points. Breadth indicators, such as the High-Low Index or the Breadth Thrust Indicator, can signal potential market reversals. For instance, if the High-Low Index starts to fall while the market continues to rise, fewer stocks participate in the uptrend, suggesting a potential market top and subsequent reversal. The interpretation of market breadth can vary depending on the overall market condition. Positive market breadth is expected in a bullish market, as most stocks are likely participating in the uptrend. In contrast, in a bearish market, negative breadth is the norm. However, sudden changes in market breadth in these conditions can signal a potential market shift. During bull markets, market breadth indicators typically show strong positive breadth, reflecting widespread buying. In contrast, bear markets often feature negative breadth, reflecting widespread selling. However, breadth indicators can often lead the market, meaning that changes in market breadth can precede shifts from bull to bear markets or vice versa. While breadth indicators can offer valuable insights, they also have limitations. For one, they can sometimes provide false signals, suggesting a trend reversal that doesn't materialize. Additionally, breadth indicators are more useful in the medium to long term and may not provide useful signals for very short-term trading. Critics of market breadth argue that it provides a simplistic view of market dynamics, ignoring that some stocks have more influence on market indexes than others due to their market capitalization. They also suggest that breadth indicators can be misleading during high market volatility. Market breadth indicators can assist in portfolio diversification decisions. For instance, if market breadth is narrow (few stocks are driving the market), it might be wise to diversify across different sectors or asset classes to reduce exposure to specific stocks. Conversely, broad market breadth might suggest that it's safe to maintain or increase exposure to the broader market. Market breadth data can also help manage risk by signaling potential market reversals or periods of increased volatility. By acting on these signals, portfolio managers can adjust their portfolio positioning to manage risk accordingly, such as reducing exposure to more risky assets or sectors when negative divergence occurs. Market breadth, an essential financial analysis tool, assesses the extent of participation in market shifts, aiding in identifying potential trends and reversals. This concept enhances understanding of a market's inherent strengths or weaknesses, allowing investors to gauge the sustainability or fragility of a trend. Technological advancements have enabled increasingly intricate market breadth analysis, with high-frequency trading and quantitative analysis facilitating real-time data tracking and scrutiny. This innovation leads to more accurate and timely market decisions. Ongoing research in market breadth offers the prospect of improved predictive abilities, particularly when combining it with diverse datasets, like social sentiment data from social media. Implementing market breadth analysis can significantly improve investment decision-making. For individuals seeking wealth growth and financial security, consulting with a wealth management advisor offering comprehensive, custom-made strategies that include market breadth analysis could be beneficial.What Is Market Breadth?
Understanding Market Breadth
Interpretation of Breadth Indicators
Market Breadth Divergence
Breadth Momentum
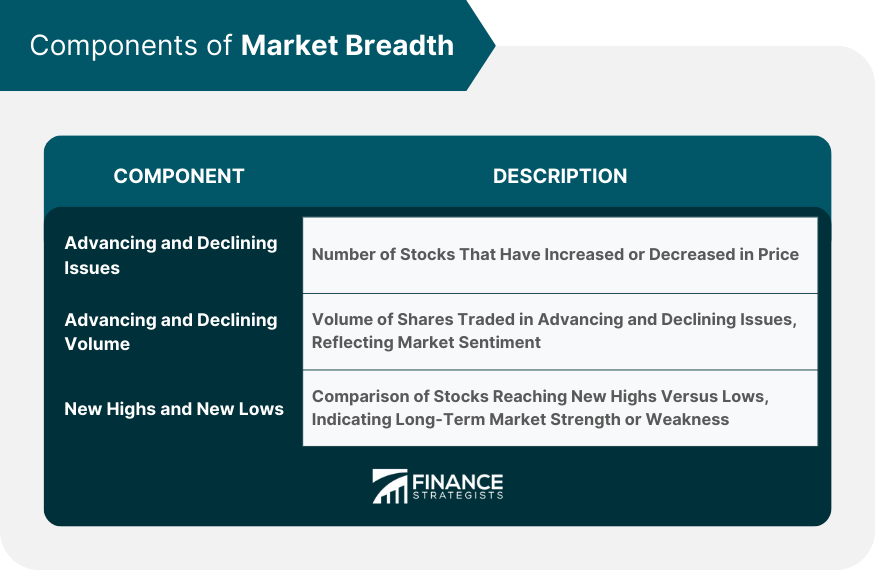
Components of Market Breadth
Number of Advancing and Declining Issues
Number of Advancing and Declining Volume
New Highs and New Lows
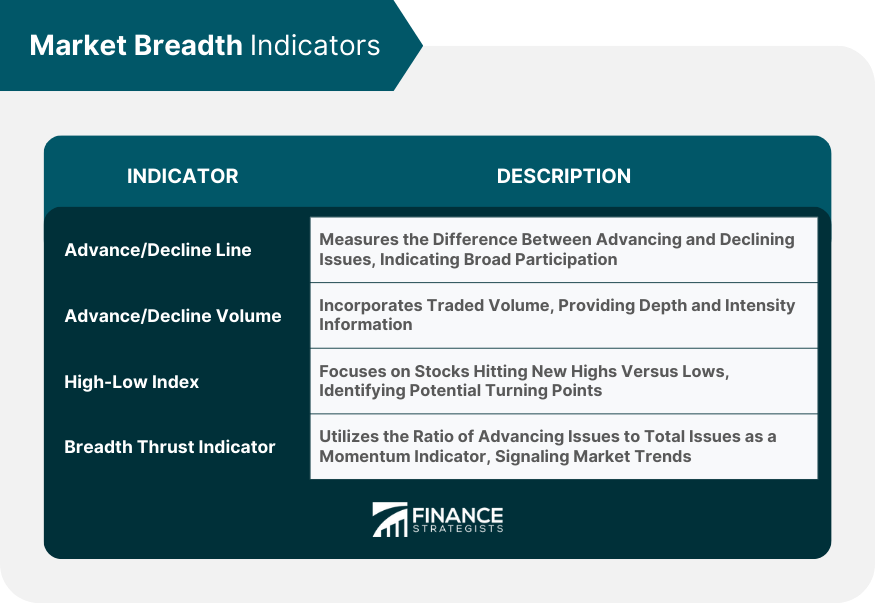
Market Breadth Indicators
Advancing/Declining Issues
Advancing/Declining Volume
High-Low Index
Breadth Thrust Indicator
Market Breadth and Market Sentiment
Correlation Between Market Sentiment and Breadth
How Breadth Indicators Predict Market Sentiment
Market Breadth and Market Timing
Usage of Breadth in Market Timing
How Breadth Indicators Can Predict Market Reversals
Advanced Market Breadth Topics
Market Breadth in Different Market Conditions
Breadth in Bear and Bull Markets
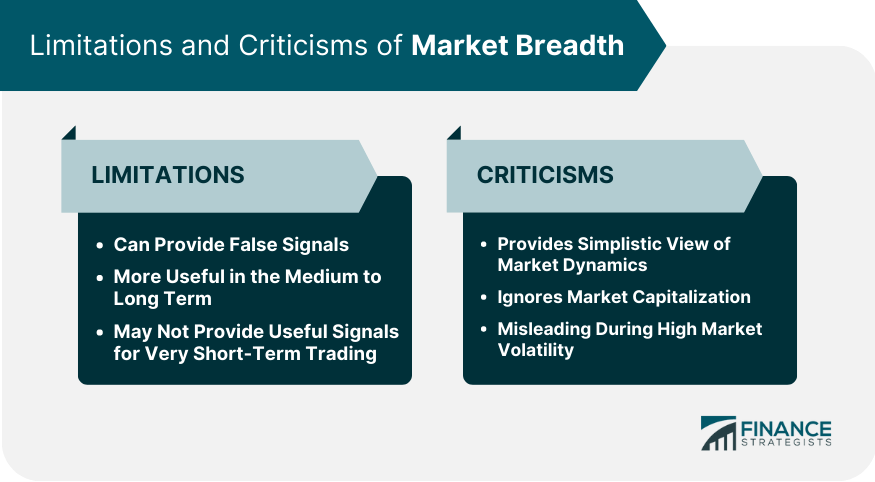
Limitations and Criticisms of Market Breadth
Limitations of Breadth Indicators
Critics of Market Breadth
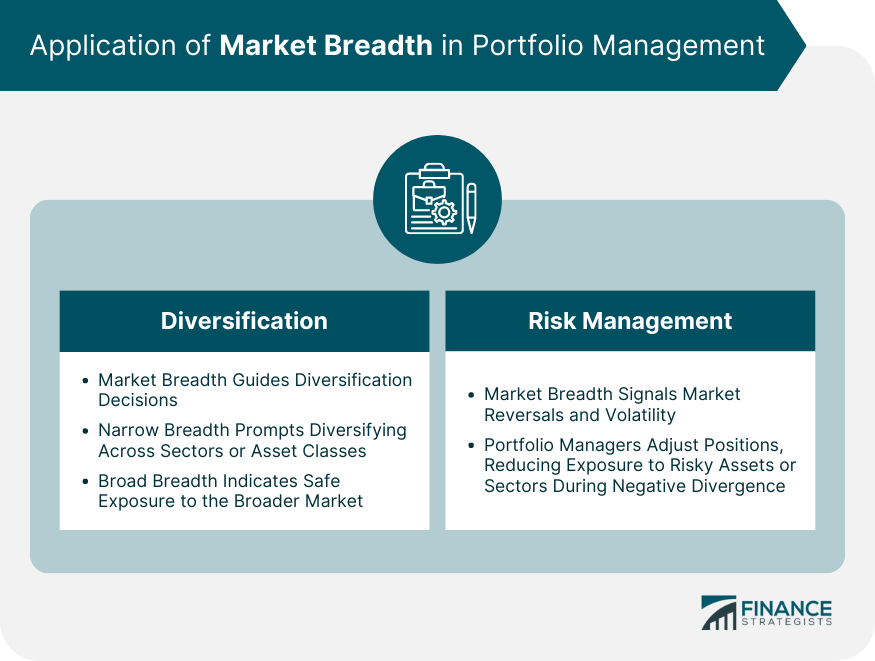
Application of Market Breadth in Portfolio Management
Diversification
Risk Management
Final Thoughts
Market Breadth FAQs
Market breadth is a concept in financial analysis that measures the number of stocks participating in a market rise or fall.
Market breadth is important as it provides insights into a market's underlying strengths or weaknesses, enabling analysts and investors to make informed decisions.
Common market breadth indicators include the Advance/Decline Line, Advance/Decline Volume Line, High-Low Index, and the Breadth Thrust Indicator.
Market breadth can be used in market timing by providing early warning signs of potential market tops or bottoms.
While market breadth can offer valuable insights, it can sometimes provide false signals and might need to be more useful for very short-term trading. It also ignores the fact that some stocks have more influence on market indexes than others due to their market capitalization.
True Tamplin is a published author, public speaker, CEO of UpDigital, and founder of Finance Strategists.
True is a Certified Educator in Personal Finance (CEPF®), author of The Handy Financial Ratios Guide, a member of the Society for Advancing Business Editing and Writing, contributes to his financial education site, Finance Strategists, and has spoken to various financial communities such as the CFA Institute, as well as university students like his Alma mater, Biola University, where he received a bachelor of science in business and data analytics.
To learn more about True, visit his personal website or view his author profiles on Amazon, Nasdaq and Forbes.


