
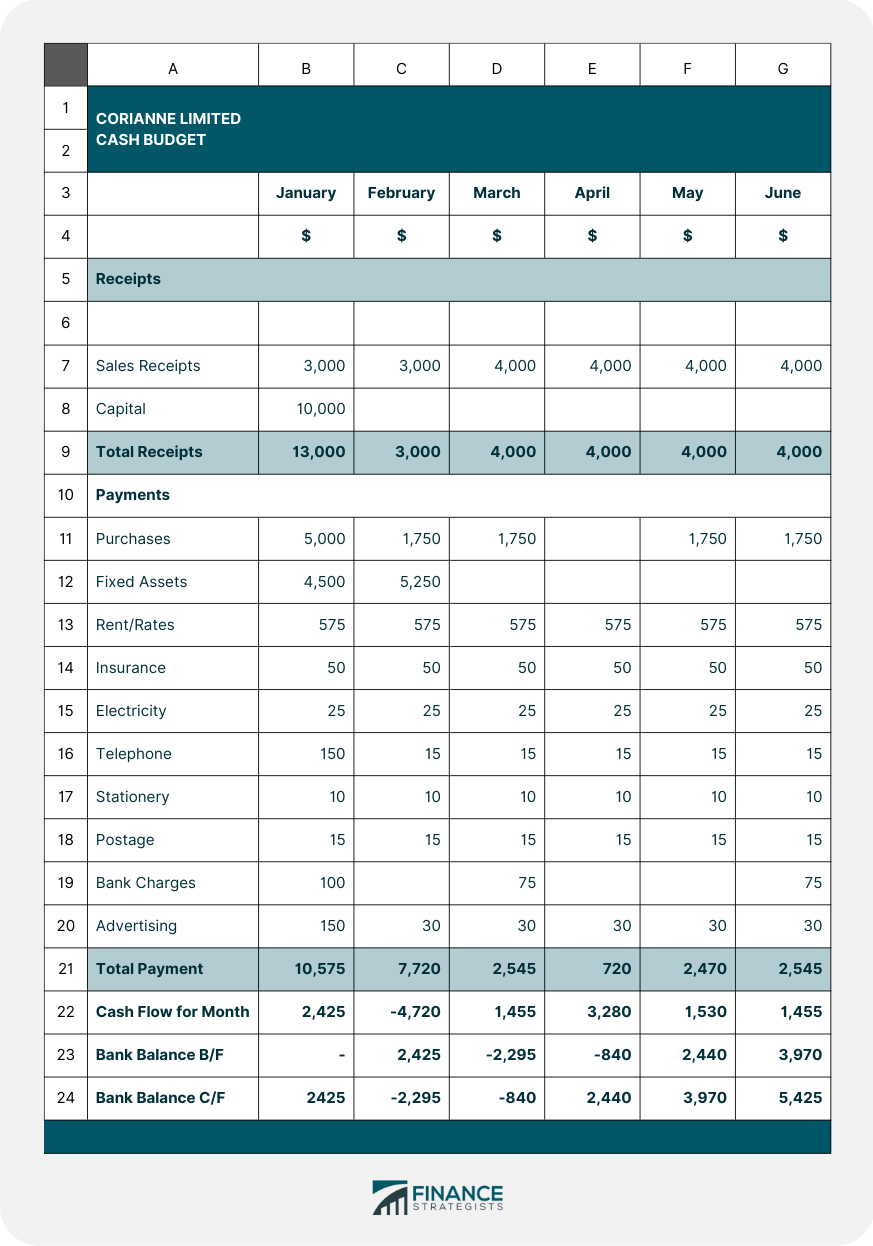
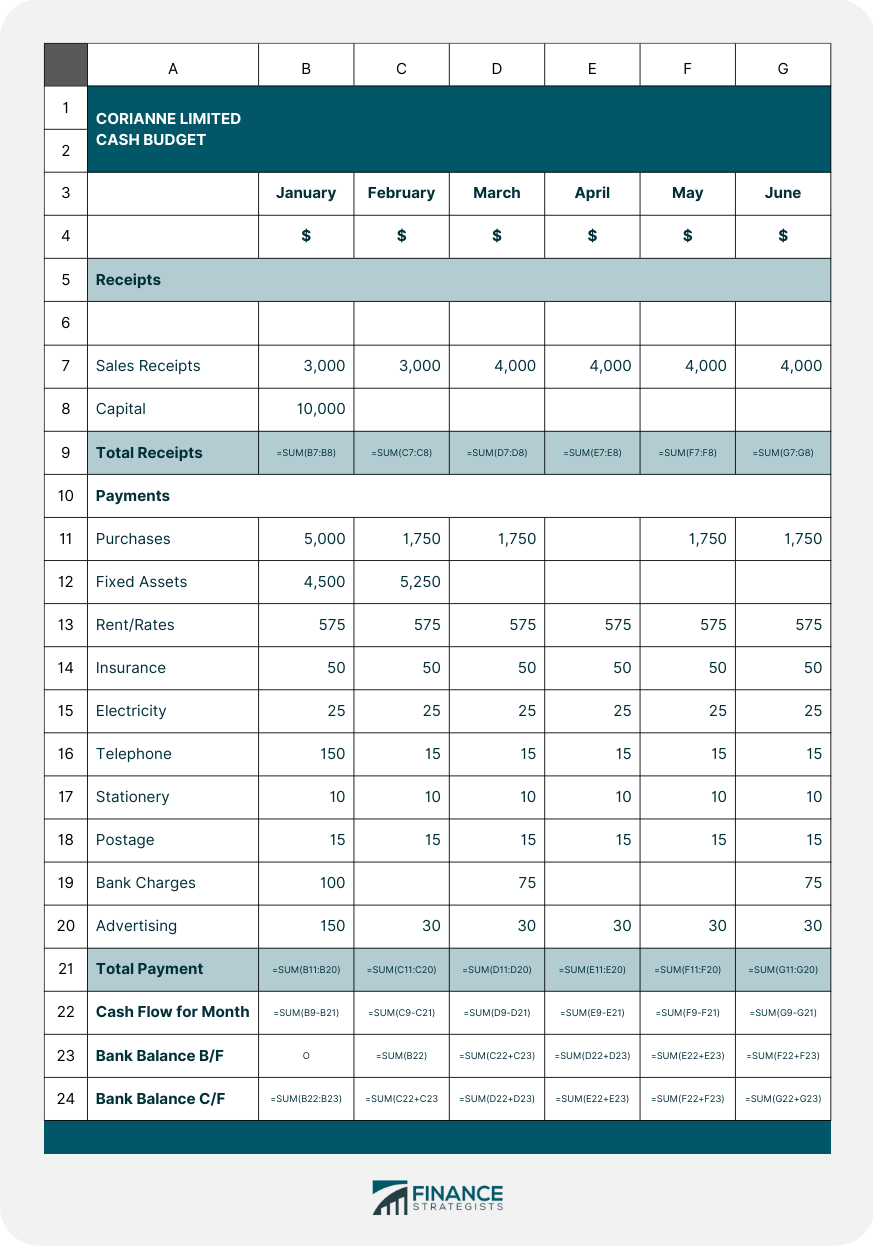
Sensitivity analysis is a powerful financial modeling technique that allows decision-makers to assess the impact of changes in key input variables on the outcome of financial models. By analyzing the relationships between independent and dependent variables, sensitivity analysis enables organizations to identify potential risks and opportunities, improving the quality of their financial decision-making. Sensitivity analysis involves examining what happens to a budget when changes are made in the assumptions on which it is based. It is also known as what-if analysis, and it can be carried out using a spreadsheet or manual calculations. Manual calculations are easier if they focus only on the parts of the budget that are subject to change. Sensitivity analysis has various essential applications in today's businesses. For example, sensitivity analysis can be applied to determine how sensitive the cash budget is to possible changes in the initial assumptions. If a change in one assumption generates only a small cash difference, there isn't any reason to be too concerned. However, a change in one assumption can sometimes lead to dramatic shifts in the company's cash position. Sensitivity analysis, therefore, is useful to determine which assumptions are critical and which have less impact. The technique investigates the impact that changes would have on the budget, ensuring managers are aware of how the situation could vary from our expected position. Sensitivity analysis is sometimes called "what-if analysis." This is an excellent name because it perfectly sums up what it focuses on. The technique simply shows the analyst what will happen to the budget if changes happen. The procedure for sensitivity analysis involves "trying out" various alterations from the original assumptions to assess the impact. This can be achieved by changing one category of receipts or payments (e.g., what if the purchase price increases by 5%?). It can also be achieved by investigating the effect of more than one change in combination (e.g., what if the purchase price increases by 5% and we have to pay off a loan in one month, not two?). You may be asked to perform sensitivity analysis in a given task, so we'll examine the numerical techniques shortly. Before we do that, it's worth examining an important practical tool for carrying out sensitivity analysis: the computer spreadsheet. The format of a cash budget is easy to reproduce on a computer spreadsheet. Formulas are used to help us avoid having to carry out all the arithmetic. Once you've opened a spreadsheet, it's a simple matter of inputting data or adding new rows/columns (e.g., for additional receipts or payments). When the spreadsheet for a cash budget is configured correctly, the total amounts for receipts and payments will automatically adjust when changes are made, together with the bank/cash balances at the bottom of the budget. An example of a cash budget layout is shown below. There are two illustrations in this example: The types of changes to data that are applied in sensitivity analysis generally fall into one of three categories. These categories are discussed below. Changes in underlying volumes are changes in the sales units or the production or purchase units. We will initially deal with straightforward price changes. In the next section, we will examine the impact of inflation and how to deal with it. We also need to assess the impact of situations in which the receipts and payments are the same as the original cash budget but they occur at different times. Examples include allowing longer (or shorter) credit terms on sales or paying for purchases or other outgoings at a different time than was originally planned. There are two approaches used to change the cash budget data: The second technique is often required in AAT simulations. This article will now examine in more detail how this is carried out. The key is to consider each month separately and perform the calculations for that month: The revised closing cash balance for that month can then be calculated and carried forward to the next month. The exercise can be carried out in the form of a table. We will use a straightforward example to demonstrate the process used to perform sensitivity analysis. The following cash budget is based on all sales made on two month's credit. March sales are estimated at $8,000. Suppose that we want to determine the impact of changing the terms of sale to one month's credit, with effect from January sales. For simplicity, we will assume that all our customers comply with the revised terms. By following the procedure outlined above, we would get the following results: In the above example, two months' sales receipts would arise in February, increasing the receipts for that month by $6,000. The changes in receipts for March and April result from receiving different month's sales than originally planned. The overall result is a new bank balance at the end of April of $5,000 instead of the original overdrawn figure of $3,000. Note that using this technique, it is only necessary to examine those lines in the cash budget that are subject to change. Here, there was no impact on payments, and so there was no need to revisit those figures. The foundation of sensitivity analysis lies in understanding the relationships between variables and parameters in financial models. Independent variables are input variables that can change, affecting the outcome of a financial model. Examples include interest rates, inflation rates, and growth rates. Dependent variables are the output variables that are influenced by the independent variables. Examples include net present value (NPV), internal rate of return (IRR), and stock prices. Assumptions and scenarios form the basis for sensitivity analysis, allowing analysts to test the effects of different input variables on financial models. This represents the most likely set of assumptions, often based on historical data and current market conditions. These are variations of the baseline scenario, incorporating changes in key assumptions to assess their impact on dependent variables. Several financial models can be used in sensitivity analysis, including: DCF estimates the value of an investment based on its expected future cash flows, discounted to their present value. CAPM calculates the expected return of an asset based on its risk relative to the overall market. This model determines the fair price of an option by considering factors such as the stock price, strike price, and time to expiration. Sensitivity analysis plays a crucial role in evaluating investments, including the valuation of stocks and bonds, and capital budgeting decisions. By adjusting key variables such as interest rates, growth rates, and dividend payout ratios, analysts can assess the impact of these changes on the valuation of stocks and bonds, providing insights into potential risks and rewards. Sensitivity analysis helps in evaluating the viability of investment projects by analyzing the impact of changes in variables like costs, revenues, and discount rates on the project's net present value (NPV) and internal rate of return (IRR). Risk management is another area where sensitivity analysis can be invaluable, as it helps organizations identify, assess, and mitigate various risks, including credit risk, market risk, and operational risk. Sensitivity analysis can be used to assess the potential impact of changes in variables such as interest rates, borrower credit scores, and economic conditions on loan portfolios. By analyzing the impact of changes in market variables like exchange rates, interest rates, and asset prices, sensitivity analysis can help organizations understand their exposure to market risk and develop appropriate hedging strategies. Sensitivity analysis can assist in identifying and quantifying the potential impact of changes in operational variables, such as production costs, labor rates, and regulatory compliance costs, on an organization's financial performance. Sensitivity analysis can be used to improve the accuracy and reliability of financial forecasts, including revenue and earnings forecasts, cash flow projections, and budgeting and financial planning. By adjusting key variables such as sales growth rates, pricing, and customer retention, sensitivity analysis can help organizations develop more accurate and robust revenue and earnings forecasts. Sensitivity analysis enables organizations to assess the impact of changes in variables like working capital requirements, capital expenditures, and financing costs on their cash flow projections. By incorporating sensitivity analysis into their budgeting and financial planning processes, organizations can identify potential risks and opportunities, allowing for more informed decision-making and resource allocation. Sensitivity analysis has its limitations and challenges, which must be considered when interpreting and applying its results. The quality of sensitivity analysis depends on the assumptions and scenarios used, which are often subjective and can be influenced by the biases of the analysts involved. Focusing too heavily on certain variables can lead to an overemphasis on their importance, potentially resulting in a misallocation of resources or incorrect decision-making. Sensitivity analysis relies on the availability and accuracy of data. Incomplete or inaccurate data can lead to misleading results and flawed decision-making. Financial models often simplify complex relationships between variables, which can result in a distorted view of reality. Sensitivity analysis may not fully capture these complexities, leading to an oversimplification of the relationships between input and output variables. Sensitivity analysis is a vital tool for financial decision-making, as it enables organizations to assess the potential impact of changes in key input variables on financial models. By understanding the risks and opportunities associated with various scenarios, decision-makers can make more informed choices and better allocate resources. To ensure the effectiveness of sensitivity analysis, organizations should adopt best practices, such as using a diverse range of scenarios and assumptions, incorporating a variety of sensitivity analysis techniques, and presenting results in a clear and accessible format. Sensitivity analysis should not be viewed as a one-time exercise but rather as an ongoing process of continuous improvement and adaptation to new information and circumstances. By regularly updating models and assumptions, organizations can ensure that their sensitivity analysis remains relevant and useful in guiding their financial decision-making.Sensitivity Analysis: Definition
Importance of Sensitivity Analysis
Using a Spreadsheet for Sensitivity Analysis
Although the practical use of spreadsheets is difficult to incorporate into AAT simulations, the knowledge and understanding requirements of the unit include computer modeling.Performing Sensitivity Analysis Manually
1. Changes in Underlying Volumes
To some extent, it could apply to overheads or fixed assets (e.g., hiring or buying additional equipment not included in the original budget).2. Changes in Prices
3. Timing Changes
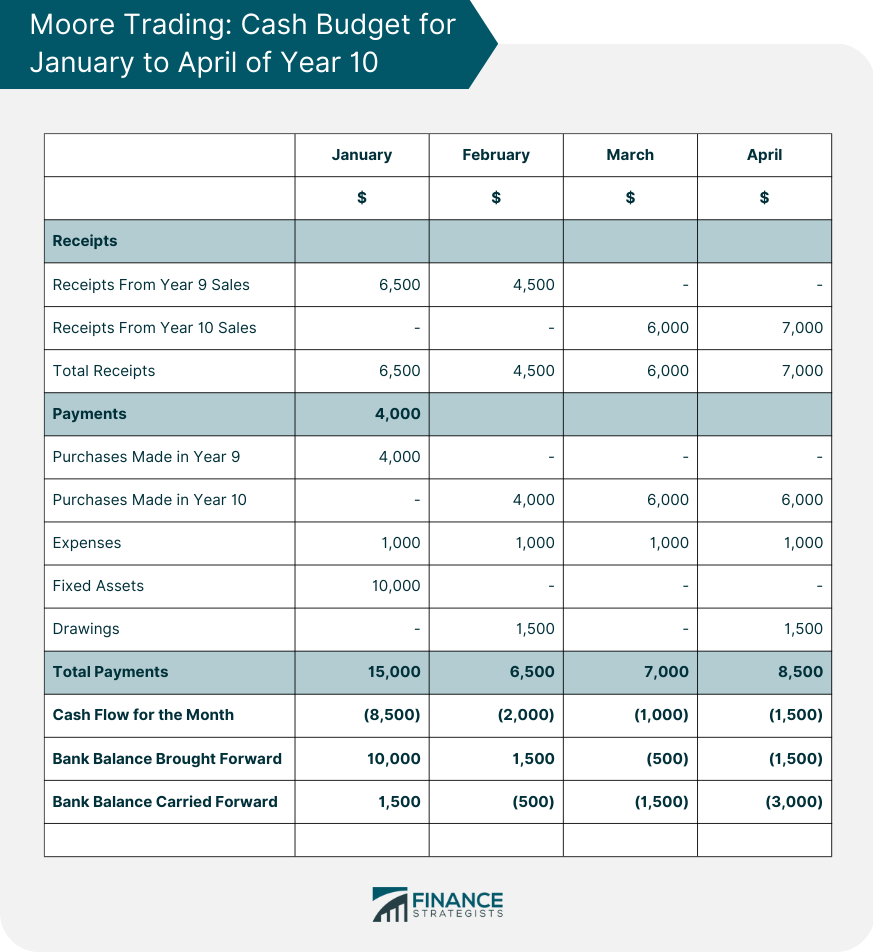
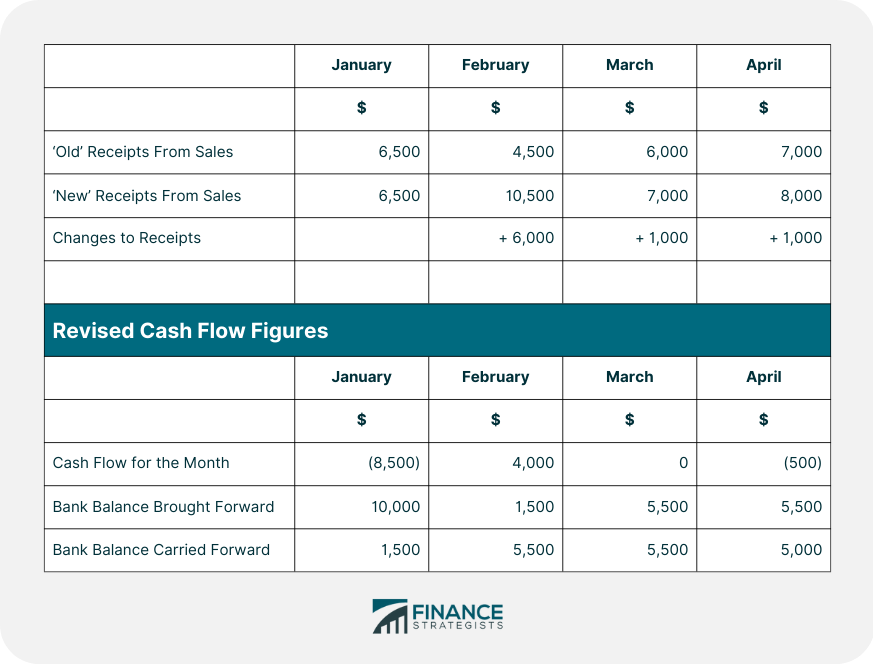
Sensitivity Analysis Examples
Key Components of Sensitivity Analysis in Finance
Variables and Parameters
Independent Variables
Dependent Variables
Assumptions and Scenarios
Baseline Scenario
Alternative Scenarios
Financial Models
Discounted Cash Flow (DCF) Model
Capital Asset Pricing Model (CAPM)
Black-Scholes Option Pricing Model
Sensitivity Analysis Applications in Finance
Investment Analysis
Valuation of Stocks and Bonds
Capital Budgeting Decisions
Risk Management
Credit Risk Assessment
Market Risk Assessment
Operational Risk Assessment
Financial Forecasting
Revenue and Earnings Forecasts
Cash Flow Projections
Budgeting and Financial Planning
Limitations and Challenges of Sensitivity Analysis in Finance
Subjectivity of Assumptions and Scenarios
Overemphasis on Specific Variables
Incomplete or Inaccurate Data
Simplification of Complex Relationships
Conclusion
Importance of Sensitivity Analysis in Financial Decision-Making
Best Practices for Conducting Sensitivity Analysis
Continuous Improvement and Adaptation to New Information and Circumstances
Sensitivity Analysis FAQs
Sensitivity analysis is a technique used in financial modeling to evaluate how changes in a specific input variable affect the output. It helps to identify the variables that have the most significant impact on the model's results.
Sensitivity analysis enables risk managers to identify the most critical risk factors and evaluate how changes in these factors affect the overall risk exposure of a portfolio.
While scenario analysis considers the impact of multiple variables in a given scenario, sensitivity analysis focuses on the impact of changes in a single variable, allowing for a more detailed analysis of its impact on the model's results.
Sensitivity analysis helps decision-makers to evaluate different scenarios and identify the critical factors that affect the outcome. This information can be used to make more informed decisions and develop robust strategies.
Some common tools used for sensitivity analysis include tornado diagrams, spider plots, and Monte Carlo simulation. These tools help to visualize the sensitivity of the model to changes in input variables and enable more informed decision-making.
True Tamplin is a published author, public speaker, CEO of UpDigital, and founder of Finance Strategists.
True is a Certified Educator in Personal Finance (CEPF®), author of The Handy Financial Ratios Guide, a member of the Society for Advancing Business Editing and Writing, contributes to his financial education site, Finance Strategists, and has spoken to various financial communities such as the CFA Institute, as well as university students like his Alma mater, Biola University, where he received a bachelor of science in business and data analytics.
To learn more about True, visit his personal website or view his author profiles on Amazon, Nasdaq and Forbes.


