
The Gravestone Doji is a type of candlestick pattern used in technical analysis to predict potential price reversals in the market. It appears when the open, closed, and low prices are the same or very close to each other, with a long upper shadow resembling an inverted "T" shape. The Gravestone Doji represents a tug-of-war between buyers and sellers where, despite buyers pushing the price significantly higher, the sellers regain control and push the price back to the opening level. This pattern, often seen at the peak of an uptrend, signals that buying pressure may be diminishing and a bearish reversal could be imminent. Identifying the Gravestone Doji pattern is valuable for traders and investors as it enables them to make well-informed decisions and effectively manage risks. As part of technical analysis, understanding this pattern requires the context of the prevailing market trend and confirmation from subsequent trading periods. The Gravestone Doji is recognized by its specific formation on a candlestick chart. It occurs when the open, low, and close prices are at the same or nearly the same level while the high price is significantly higher. This pattern is marked by a long upper shadow, which represents the trading range between the highest traded price and the opening price. This extended shadow reflects a considerable intraday upward price movement followed by a significant retreat, culminating at or near the opening price. A defining characteristic of a Gravestone Doji is the absence (or minimal presence) of a lower shadow. This signals that the market’s bears successfully overwhelmed the bulls during the trading period, pushing prices back down from the peak. For a Gravestone Doji to be a valid indicator, it should appear after an uptrend or at least a significant bullish candle. This pattern's formation signifies a struggle between buyers and sellers where, despite initial bullish momentum, the sellers take control by the end of the session. Throughout the trading day, the price of the security rises after opening, creating a high. However, by the end of the trading session, the price retreats and closes at or near the opening price. The result is a candlestick with a long upper shadow and little to no lower shadow—our Gravestone Doji. The power struggle between buyers and sellers that occurs during the formation of a Gravestone Doji is manifest in the final price, which ends up being close to or the same as the opening price. This dynamic indicates a possible loss of bullish momentum and a potential shift toward a bearish trend. Investors and traders should consider the Gravestone Doji as a warning sign of possible changes in market sentiment. If interpreted correctly and supported by other technical indicators, it could provide a signal to exit long positions or even enter a short position. The Gravestone Doji is primarily considered a bearish reversal indicator. However, this interpretation is most effective when confirmed by a subsequent bearish candlestick, further reinforcing the reversal sentiment. Volume plays a crucial role in interpreting the Gravestone Doji. A higher trading volume on the day a Gravestone Doji forms may strengthen the bearish reversal signal because it indicates increased trading activity as the trend shifts. While the Gravestone Doji is a bearish pattern, its counterpart, the Dragonfly Doji, signals potential bullish reversals. The Dragonfly Doji is formed when the open, high, and close prices are the same or nearly the same, with a long lower shadow and no upper shadow. Other common Doji patterns include the Long-legged Doji and Four Price Doji. The Long-legged Doji has long upper and lower shadows, reflecting indecision in the market, while the Four Price Doji, where all prices are the same, represents the highest level of market uncertainty. The Gravestone Doji, like most candlestick patterns, is best used in conjunction with other technical indicators, such as moving averages, Relative Strength Index (RSI), or Bollinger Bands, to validate the trend reversal. Moreover, combining technical analysis with fundamental analysis can lead to more robust investment decisions. The Gravestone Doji may signal a trend reversal. Still, a thorough understanding of the underlying asset's intrinsic value can help ascertain whether the reversal is a temporary correction or a fundamental shift. Incorporating the Gravestone Doji into a trading strategy should also involve setting up risk management parameters and exit strategies. A stop-loss order above the high of the Gravestone Doji candle can help limit potential losses if the anticipated bearish reversal doesn't materialize. The Gravestone Doji, like any technical analysis tool, is not foolproof. It can produce false signals, and misinterpretation is possible, especially in volatile markets. It is essential to wait for confirmation from subsequent candles before making a trading decision based on this pattern. A single Gravestone Doji does not guarantee a market reversal. It is always recommended to wait for additional confirmation from the following trading sessions, such as another bearish candlestick pattern or a break below the Gravestone Doji's low price. The Gravestone Doji is a significant indicator in technical analysis, indicating potential bearish reversals. Recognizable by its distinct formation with similar open, low, and close prices and a high price significantly above these levels, it portrays the market dynamics between bulls and bears. The formation and interpretation of this pattern are central to trading strategies, aiding traders in informed decision-making and risk management. While it provides vital signals, it's crucial to combine it with other technical indicators and fundamental analysis for a comprehensive view of the market. Volume, existing market trends, and subsequent trading sessions are all critical in corroborating its signals. Lastly, it's vital to remember that the Gravestone Doji, like any analytical tool, may give false signals. Therefore, proper risk management and waiting for confirmation from following trading sessions are always recommended.What Is Gravestone Doji?
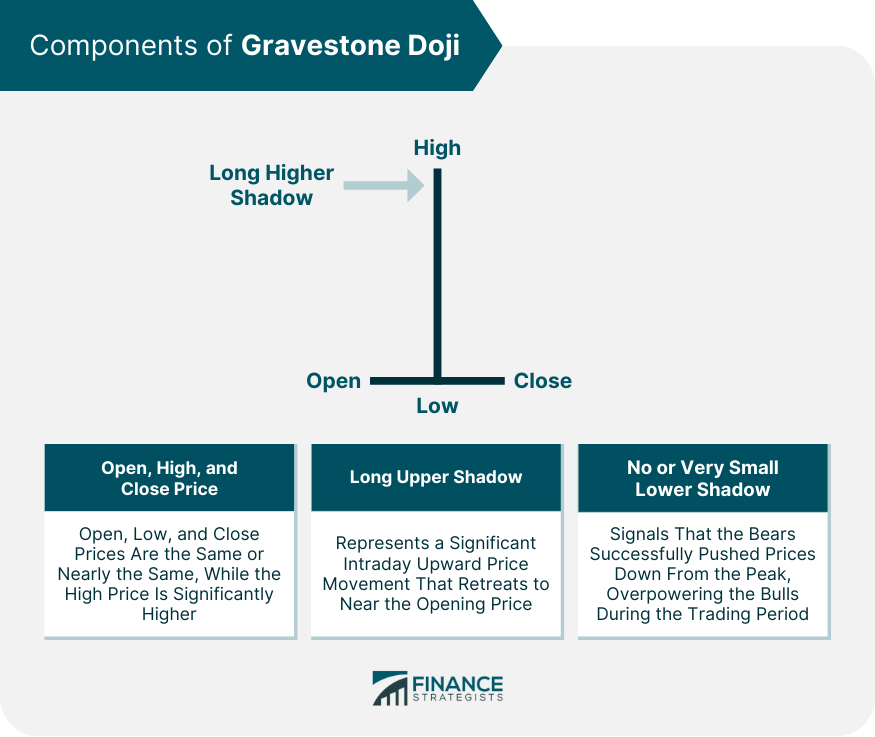
Components of Gravestone Doji
Open, High, and Close Price
Long Upper Shadow
No or Very Small Lower Shadow
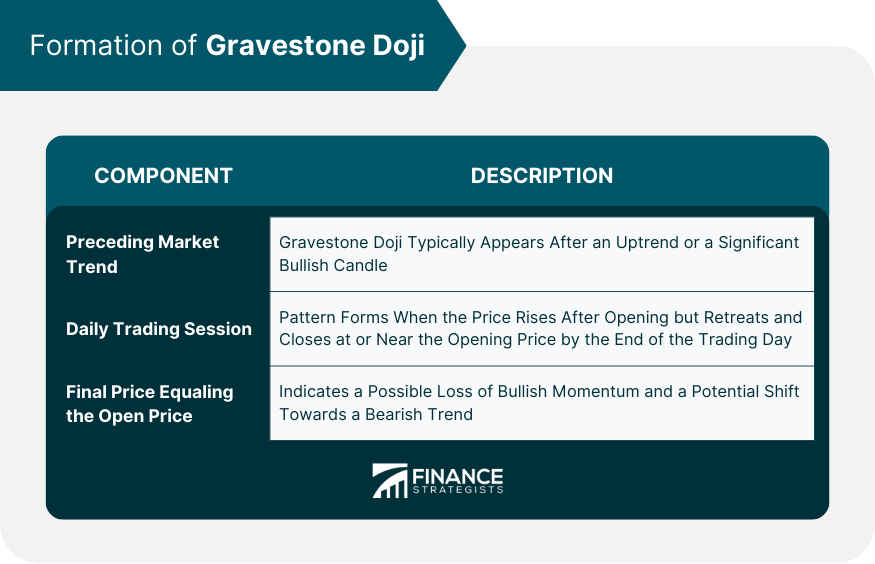
Formation of Gravestone Doji
Preceding Market Trend
Daily Trading Session
Final Price Equaling the Open Price
Interpreting Gravestone Doji
Implications for Investors and Traders
Role as a Bearish Reversal Indicator
Importance of Volume
Gravestone Doji vs Other Doji Patterns
Differences Between Gravestone Doji and Dragonfly Doji
Comparisons Between Long-Legged Doji and Four-Price Doji
Utilization of Gravestone Doji in Trading Strategies
Integration with Other Technical Indicators
Combining With Fundamental Analysis
Risk Management and Exit Strategies
Limitations of Gravestone Doji
False Signals and Misinterpretation
Need for Confirmation From Subsequent Trading Sessions
Final Thoughts
Gravestone Doji FAQs
A Gravestone Doji is a type of candlestick pattern in technical analysis. It's recognized by its specific formation where the open, low, and close prices are the same or nearly the same, while the high price is significantly higher, resembling a gravestone.
A Gravestone Doji is formed during a trading session where prices rise after opening, creating a high, but by the end of the trading session, prices retreat and close at or near the opening price. It typically appears after an uptrend or a significant bullish candle.
The main components of a Gravestone Doji are the open, high, and close prices, which are at the same or nearly the same level, a long upper shadow, and no or very small lower shadow.
A Gravestone Doji is considered a bearish reversal signal in trading. It indicates that despite initial bullish momentum, sellers take control by the end of the session, suggesting a potential shift towards a bearish trend.
While a Gravestone Doji can be a powerful indicator, it has limitations. It can produce false signals, and its interpretation can be challenging, especially in volatile markets. Additionally, a single Gravestone Doji doesn't guarantee a market reversal, and traders should always wait for additional confirmation from subsequent trading sessions.
True Tamplin is a published author, public speaker, CEO of UpDigital, and founder of Finance Strategists.
True is a Certified Educator in Personal Finance (CEPF®), author of The Handy Financial Ratios Guide, a member of the Society for Advancing Business Editing and Writing, contributes to his financial education site, Finance Strategists, and has spoken to various financial communities such as the CFA Institute, as well as university students like his Alma mater, Biola University, where he received a bachelor of science in business and data analytics.
To learn more about True, visit his personal website or view his author profiles on Amazon, Nasdaq and Forbes.


