
The Guppy Multiple Moving Average is a technical analysis tool developed by Daryl Guppy, an Australian financial trader, and author. This indicator aims to identify changing trends, potential reversals, and the strength of current trends in financial markets. The GMMA consists of two sets of exponential moving averages (EMAs) - one set for short-term traders and the other for long-term investors. The short-term GMMA, often displayed in a lighter color, comprises six EMAs with periods between 3 and 15 days. It reflects the behavior and sentiment of short-term traders or speculators. On the other hand, the long-term GMMA, often shown in a darker color, includes six EMAs with periods between 30 and 60 days, representing the behavior and sentiment of long-term investors. GMMA is a vital trading tool because it gives traders the ability to discern changes in market sentiment, thereby identifying potential entry and exit points. By interpreting the interaction between short-term and long-term traders, GMMA helps in identifying developing trends and potential reversals. Daryl Guppy, an experienced trader and popular author, is the brain behind GMMA. Guppy developed the GMMA as a way of visually representing the sentiment and behavior of traders and investors within the market. The GMMA is grounded in the belief that markets are driven by two participating groups – short-term traders and long-term investors. Each group has different expectations and motivations, and by analyzing the interplay between the two, the GMMA seeks to interpret their collective market sentiment. The GMMA consists of a collection of exponential moving averages calculated over different time frames. Specifically, it includes six short-term EMAs (3, 5, 8, 10, 12, and 15 days) and six long-term EMAs (30, 35, 40, 45, 50, and 60 days). The short-term moving averages represent the traders' activity. They respond quickly to changes in price activity, thus demonstrating the traders' sentiment and their immediate reactions to market events. Long-term moving averages, on the other hand, reflect the activity of investors who trade based on long-term value assessments. These averages move more slowly and display the investors' long-term sentiment toward a security's value. The interaction between the two sets of moving averages provides valuable insights into market trends and potential reversals. The convergence, divergence, and crossover of these EMAs create the basis for GMMA analysis. In GMMA, crossovers between the short-term and long-term averages signal potential trend changes. When short-term averages cross above the long-term ones, it indicates a bullish trend, and vice versa for a bearish trend. Expansion (separation between the averages) shows strong sentiment and, thus, trend continuation. In contrast, compression (averages coming together) often suggests weakening sentiment and a potential trend reversal. When prices are consistently closer to the short-term GMMA band, the trend is typically strong. On the other hand, when prices begin to move towards the long-term GMMA band, it may signal to weaken short-term sentiment and potential trend reversal. By observing the separation between the short-term and long-term GMMA bands, and traders can identify the existing market trend. A wide separation indicates a strong trend, while a narrow one suggests a weak or non-trending market. When the short-term GMMA crosses over the long-term GMMA, it can signal a trend reversal. Also, when the two bands compress, it can suggest that a reversal may be near. The degree of separation between the GMMA bands can indicate the strength of a trend. A large separation suggests strong sentiment and a strong trend, while a small separation implies a weak sentiment and a weak trend. Swing traders can use GMMA to identify entry and exit points based on observed changes in market sentiment. For instance, an expanding GMMA may signal a good entry point, while a compressing GMMA could suggest an exit. GMMA can also be used to identify breakouts. When prices break through the GMMA bands with a widening gap between the short-term and long-term MAs, it can signal a strong breakout. Day traders can use GMMA to spot intraday trend reversals. A crossover of the short-term MAs over the long-term MAs, for instance, can suggest a possible trend reversal. GMMA offers a number of advantages for traders and investors. Below are the main benefits it provides. Perhaps the biggest advantage of GMMA is its ability to offer a comprehensive view of market sentiment. It does this by distinguishing between short-term trader behavior and long-term investor behavior. The shorter moving averages represent the traders, while the longer ones represent investors. This allows users to understand and interpret the different market dynamics at play. GMMA is particularly effective in helping traders identify market trends, whether they are bullish (upward) or bearish (downward). When the short-term moving averages cross above the long-term moving averages, it could signal a bullish trend. Conversely, when the short-term moving averages cross below the long-term moving averages, it might indicate a bearish trend. GMMA also aids in spotting potential trend reversals. When the short-term and long-term groups of moving averages converge, diverge, or cross each other, it often signifies a potential shift in market direction. Given its ability to represent market sentiment and detect trends, GMMA can aid traders in making informed decisions about their positions. Traders can use these insights to determine when to enter or exit a trade or when to hold onto their positions, ultimately helping to enhance their trading strategy. Despite its many benefits, GMMA also comes with certain limitations that traders need to be aware of. GMMA, like all technical analysis tools, is heavily reliant on past price data. While this information can be useful in anticipating potential future price movements, it does not guarantee that these predictions will come to pass. Changes in market conditions, news events, and other unpredictable factors can influence market behavior and lead to deviations from anticipated trends. GMMA is considered a lagging indicator, meaning it follows price movements and can only provide signals after a trend has started. Consequently, its signals may not always be timely, and traders might miss opportunities if they rely solely on GMMA. Additionally, it can potentially give false signals in volatile markets, leading traders into disadvantageous trades. Unlike the SMA, which assigns equal weight to all data points, GMMA uses exponential moving averages that assign more weight to recent data. This makes GMMA more responsive to recent price changes than SMA. While both GMMA and EMA use exponential calculations, GMMA incorporates multiple EMAs to capture the sentiment of different market participants. EMA, on the other hand, uses a single EMA to identify trends. While both GMMA and MACD are trend-following momentum indicators, they serve different purposes. MACD is used to spot changes in the strength, direction, momentum, and duration of a trend, while GMMA is used to understand the behavior of different market participants. The Guppy Multiple Moving Average (GMMA) is a unique tool in the technical analysis developed by financial trader Daryl Guppy. This tool reveals the distinct sentiment of short-term traders and long-term investors by analyzing two sets of exponential moving averages (EMAs). It enables the detection of changing trends, potential reversals, and trend strength, hence facilitating effective trading decisions. The GMMA offers significant insights through crossovers, and band expansion and compression, with the price relationship to GMMA bands further enhancing interpretation. Its application ranges from identifying market trends and spotting reversals to assessing trend strength. Despite limitations such as being a lagging indicator, GMMA's comprehensive view of market sentiment sets it apart from other indicators like SMA, EMA, and MACD. The utilization of GMMA within various trading strategies signifies its versatility, underscoring its critical role in facilitating informed trading decisions.Overview of Guppy Multiple Moving Average (GMMA)
Importance of GMMA
Understanding GMMA
Developer: Daryl Guppy
Core Philosophy Behind GMMA
Components of GMMA
Technical Components of GMMA
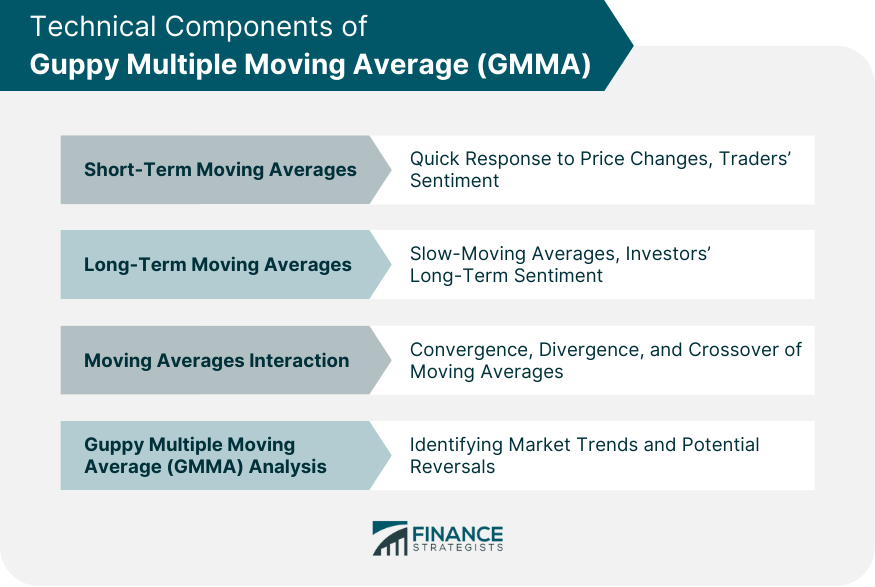
Short-Term Moving Averages
Long-Term Moving Averages
Interaction Between Short-Term and Long-Term MAs
Interpretation of GMMA
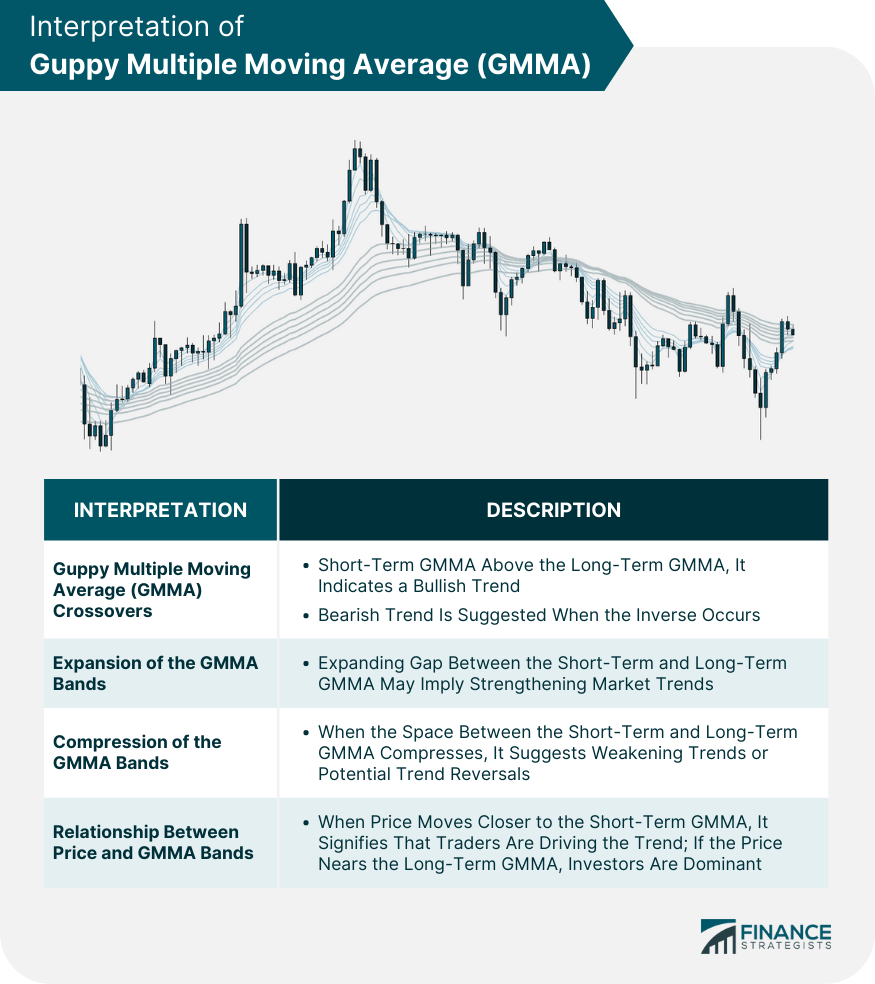
GMMA Crossovers
Expansion and Compression of the GMMA
Relationship Between Price and GMMA Bands
Application of GMMA
Identifying Market Trends
Spotting Trend Reversals
Assessing the Strength of Trends
GMMA in Trading Strategies
Incorporating GMMA Into Swing Trading
Using GMMA for Breakout Trading
Role of GMMA in Day Trading
Benefits of Utilizing GMMA
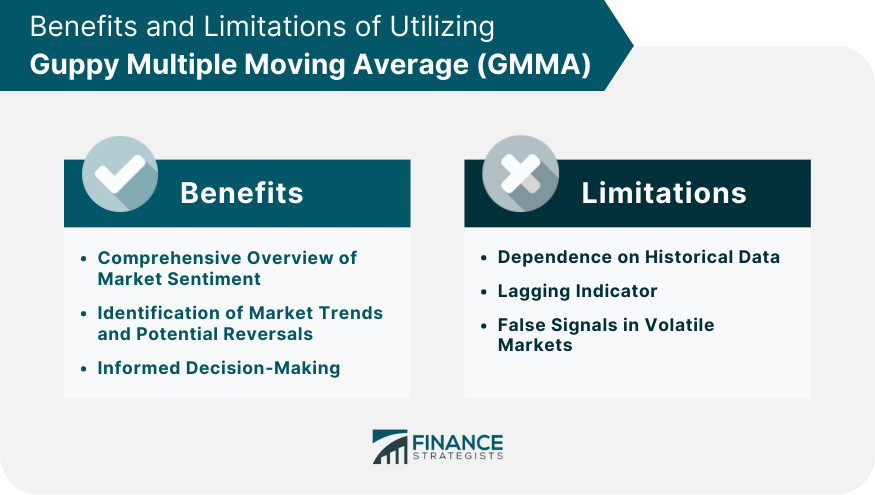
Comprehensive Overview of Market Sentiment
Identification of Market Trends and Potential Reversals
Informed Decision-Making
Limitations of GMMA
Dependence on Historical Data
Lagging Indicator
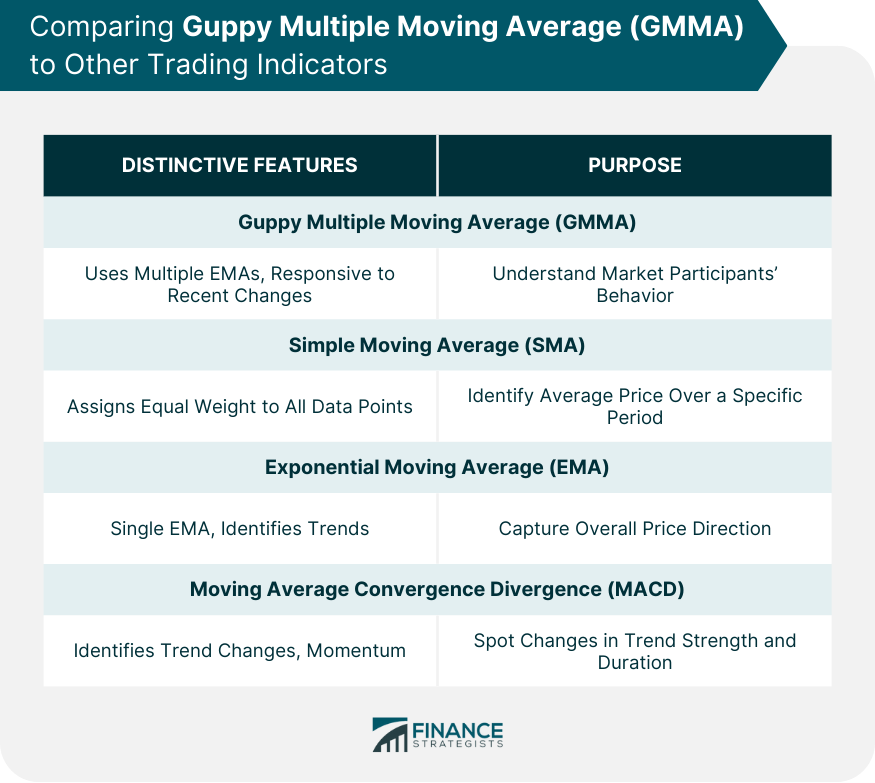
Comparing GMMA to Other Trading Indicators
GMMA vs Simple Moving Average (SMA)
GMMA vs Exponential Moving Average (EMA)
GMMA vs Moving Average Convergence Divergence (MACD)
Final Thoughts
Guppy Multiple Moving Average (GMMA) FAQs
The Guppy Multiple Moving Average (GMMA) is a technical analysis tool that uses twelve different exponential moving averages (EMAs) to evaluate the behavior and sentiment of both short-term traders and long-term investors. The interaction between the two sets of EMAs provides insights into market trends and possible reversals.
The GMMA was developed by Australian financial trader and author Daryl Guppy. He created the GMMA to offer a more comprehensive understanding of market sentiment by distinguishing between the activities of short-term traders and long-term investors.
GMMA uses two groups of EMAs. The first group tracks the sentiment and behavior of short-term traders, while the second reflects that of long-term investors. When these groups cross over, it can signal a change in trend. The distance between the two groups also provides insight into the strength of a trend.
The main advantage of using GMMA is its ability to identify and differentiate the sentiment and behavior of short-term and long-term market participants. This can help traders understand market trends, identify potential reversals, and assess the strength of existing trends.
GMMA, like any other technical analysis tool, is not foolproof. It uses historical price data and therefore cannot predict future price movements with absolute certainty. Moreover, as a lagging indicator, GMMA may not always provide timely signals. Therefore, it's recommended to use it in conjunction with other technical analysis tools.
True Tamplin is a published author, public speaker, CEO of UpDigital, and founder of Finance Strategists.
True is a Certified Educator in Personal Finance (CEPF®), author of The Handy Financial Ratios Guide, a member of the Society for Advancing Business Editing and Writing, contributes to his financial education site, Finance Strategists, and has spoken to various financial communities such as the CFA Institute, as well as university students like his Alma mater, Biola University, where he received a bachelor of science in business and data analytics.
To learn more about True, visit his personal website or view his author profiles on Amazon, Nasdaq and Forbes.


