
The Ichimoku Cloud, or Ichimoku Kinko Hyo, is a comprehensive technical analysis tool that depicts support and resistance levels, trend direction, and price momentum in a single view, embodying its Japanese name meaning "one glance." Developed by Japanese journalist Goichi Hosoda in the late 1930s, the system was made public after three decades of rigorous testing and refinement. Its design allows for application across any timeframe or trading market, catering to diverse trading styles and strategies. Valued for its comprehensive approach, the Ichimoku Cloud provides multifaceted market analysis unlike many other tools, including trends, momentum, support and resistance data, as well as buy and sell signals, and potential price movement predictions. Despite presenting complex data, it maintains visual simplicity, earning appreciation from traders. Calculation: The Tenkan-Sen, or Conversion Line, is calculated by taking the average of the highest high and the lowest low over the past 9 periods. Interpretation: When the Conversion Line moves above the Base Line, it's a bullish signal, indicating it might be a good time to buy. Conversely, when it moves below the Base Line, it's a bearish signal, suggesting it might be a good time to sell. Calculation: The Kijun-Sen, or Base Line, is similar to the Conversion Line, but it considers the past 26 periods instead. Interpretation: The Base Line represents the longer-term market equilibrium and serves as a "trigger" line. When the price crosses above the Base Line, it can be considered a bullish signal. Conversely, when the price crosses below, it's seen as a bearish signal. Calculation: The Senkou Span A, or Leading Span A, is the average of the Conversion Line and the Base Line, plotted 26 periods into the future. Interpretation: The Leading Span A forms one edge of the "cloud." It represents one of the two main areas of future resistance and support. Calculation: The Senkou Span B, or Leading Span B, is calculated by taking the average of the highest high and the lowest low over the past 52 periods, plotted 26 periods ahead. Interpretation: The Leading Span B forms the other edge of the "cloud." A wider distance between Span A and Span B creates a stronger support or resistance area, known as the cloud or "Kumo." Calculation: The Chikou Span, or Lagging Span, is the closing price of the current period, plotted 26 periods behind. Interpretation: The Lagging Span is used to show past market performance relative to current prices. It's useful for spotting potential trend reversals and confirming signals. Formation: The Cloud, or Kumo, is the area between Leading Span A and Leading Span B. Interpretation: The Cloud serves as a key visual indicator of the Ichimoku system. When prices are above the cloud, it's typically seen as bullish, and when they're below, it's viewed as bearish. Price Above the Cloud: One of the key bullish signals in Ichimoku trading is when the price moves above the cloud. This move signifies potential upward momentum. Tenkan-Sen Crossing Above Kijun-Sen: Another bullish signal occurs when the Tenkan-Sen (Conversion Line) crosses above the Kijun-Sen (Base Line). This is known as a bullish crossover. Chikou Span Confirmation: The Chikou Span (Lagging Span) is used to confirm the bullish signals. If it's above the price of 26 periods ago, this confirms the bullish sentiment. Price Below the Cloud: A key bearish signal is when the price drops below the cloud, which suggests potential downward momentum. Tenkan-Sen Crossing Below Kijun-Sen: A bearish crossover occurs when the Tenkan-Sen crosses below the Kijun-Sen. This signals that it might be a good time to sell. Chikou Span Confirmation: Bearish signals are confirmed when the Chikou Span is below the price of 26 periods ago, backing the bearish market sentiment. Using the Ichimoku Cloud in multiple time frame analysis can help traders identify longer-term trends and potentially more significant support and resistance levels. Traders often look for confirmation across different time frames to strengthen their market bias. In Ichimoku Cloud analysis, the areas of support and resistance often switch roles once the price breaks through them. This means that a previous support level can become resistance, and vice versa. Understanding these role reversals can provide additional insights into potential market reversal points. While powerful on its own, the Ichimoku Cloud can be combined with other technical indicators to improve its effectiveness. For instance, using Ichimoku with oscillators like the Relative Strength Index (RSI) can help confirm momentum signals, or with volume-based indicators to verify the strength of a trend. While the Ichimoku Cloud excels in trending markets, its effectiveness can diminish in sideways or ranging markets. The signals can become less reliable, and the cloud may not accurately represent support and resistance levels. Volatility can significantly impact the Ichimoku Cloud. Increased market volatility can expand the cloud, potentially creating false signals or unclear trends. While the Ichimoku Cloud provides a wealth of information, it's important to use additional confirming indicators or strategies. This can help avoid false signals and increase trading accuracy. Regardless of the strategy or tool used, risk management is crucial in trading. Traders should always set stop-loss orders and avoid investing more than they can afford to lose. The Ichimoku Cloud is a versatile technical analysis tool that offers a detailed snapshot of market trends, momentum, and support and resistance levels through five distinct lines. It's commonly used by traders to spot potential trading signals by analyzing price interactions with the cloud and lines. However, it's less reliable in sideways or volatile markets and, like all tools, necessitates a solid understanding and careful interpretation. Therefore, it's critical to use it in conjunction with other indicators and robust risk management strategies. Despite its intricacies, the Ichimoku Cloud is a valuable addition to a trader's toolkit. As you delve into its strategies and nuances, consider enlisting the help of professional wealth management services to maximize its potential and align your trading strategies with your overall financial objectives.What Is the Ichimoku Cloud?
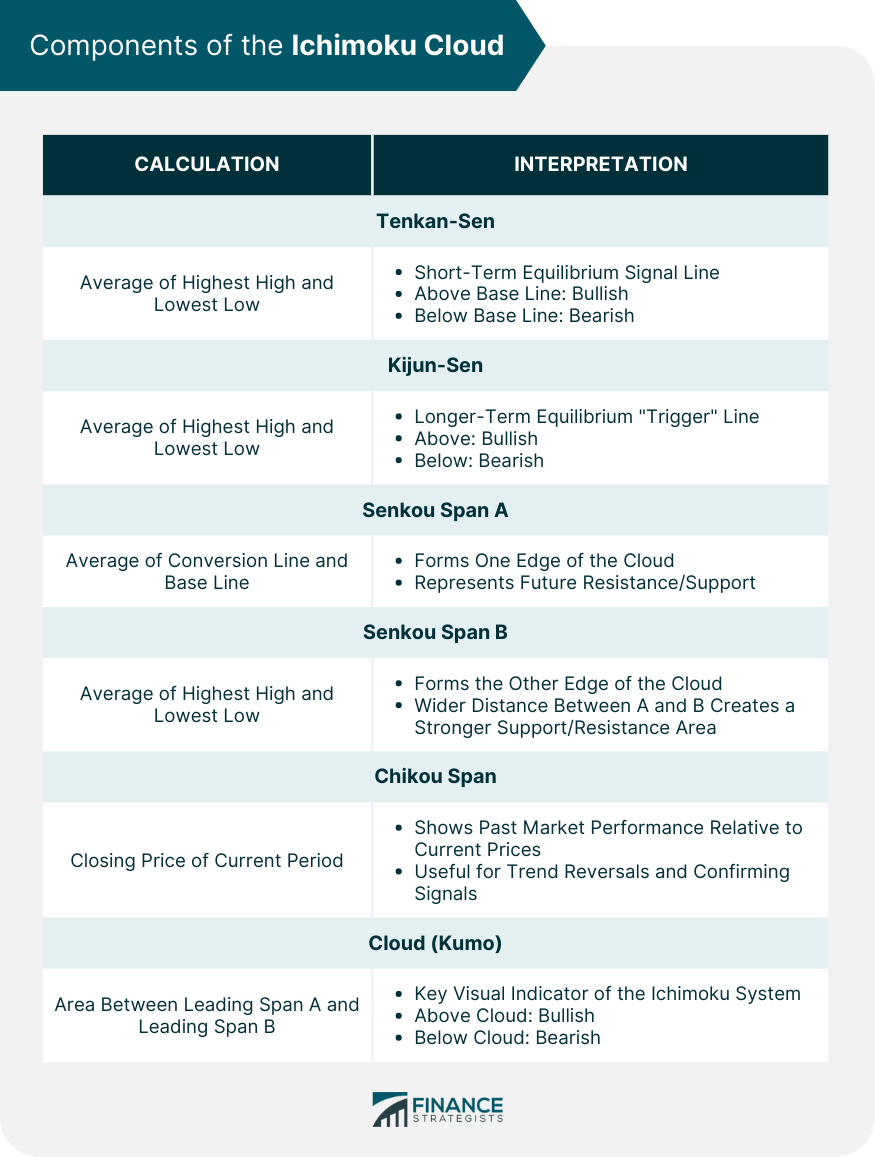
Understanding the Components of the Ichimoku Cloud
Tenkan-Sen (Conversion Line)
Kijun-Sen (Base Line)
Senkou Span A (Leading Span A)
Senkou Span B (Leading Span B)
Chikou Span (Lagging Span)
The Cloud (Kumo)
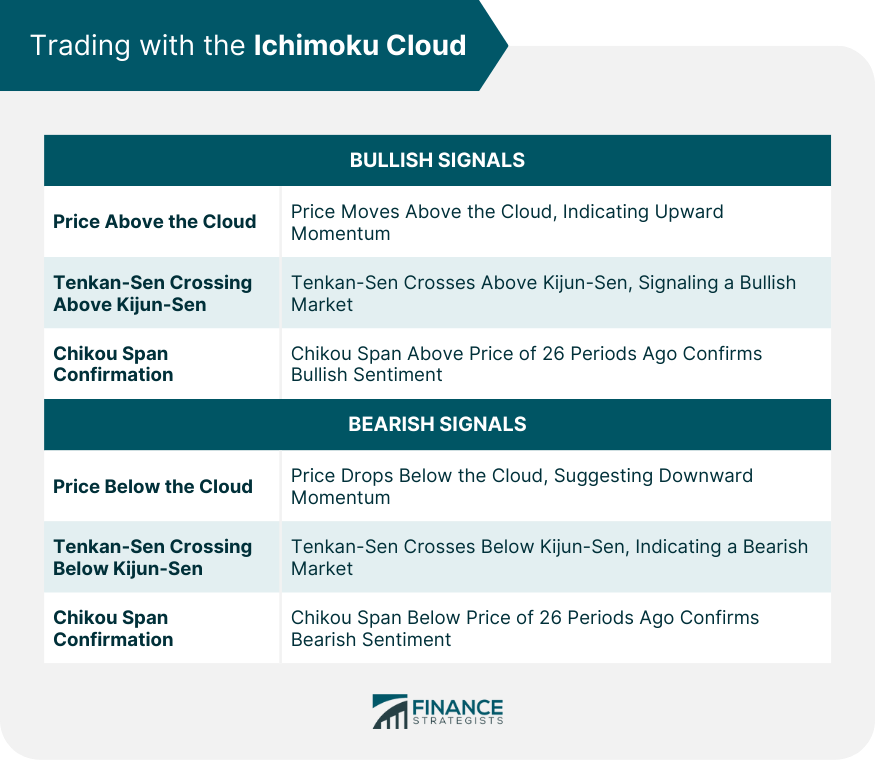
Trading With the Ichimoku Cloud
Bullish Signals
Bearish Signals
Advanced Techniques and Strategies With the Ichimoku Cloud
Multiple Time Frame Analysis
Role Reversals: Support and Resistance
Using Ichimoku With Other Indicators
Limitations and Considerations When Using the Ichimoku Cloud
Limitations in Sideways Markets
Role of Volatility
Necessity for Confirming Indicators and Strategies
Importance of Risk Management
Final Thoughts
Ichimoku Cloud FAQs
The Ichimoku Cloud is a comprehensive technical analysis tool that provides information about support and resistance levels, trend direction, and price momentum at a glance.
The Ichimoku Cloud is composed of five lines: Tenkan-Sen, Kijun-Sen, Senkou Span A, Senkou Span B, and Chikou Span, each calculated based on high and low prices over different periods.
Trading with the Ichimoku Cloud involves analyzing the positions of the price, the lines, and the cloud. Bullish and bearish signals are given when the price moves above or below the cloud, and the lines cross each other.
The Ichimoku Cloud can be less effective in sideways markets, and high volatility can impact its accuracy. Therefore, it's important to use it alongside other confirming indicators and risk management strategies.
The Ichimoku Cloud projects certain data into the future, providing an estimate of where support and resistance might be in the future. However, like all tools, it's not 100% accurate and should be used in conjunction with other analysis methods.
True Tamplin is a published author, public speaker, CEO of UpDigital, and founder of Finance Strategists.
True is a Certified Educator in Personal Finance (CEPF®), author of The Handy Financial Ratios Guide, a member of the Society for Advancing Business Editing and Writing, contributes to his financial education site, Finance Strategists, and has spoken to various financial communities such as the CFA Institute, as well as university students like his Alma mater, Biola University, where he received a bachelor of science in business and data analytics.
To learn more about True, visit his personal website or view his author profiles on Amazon, Nasdaq and Forbes.


