
Financial ratios are numerical expressions that indicate the relationship between various financial statement items, such as assets, liabilities, revenues, and expenses. These ratios are important for businesses, investors, creditors, and other stakeholders as they help in evaluating a company's financial health, performance, and market position. Financial ratios serve various purposes, including assessing a company's financial stability, profitability, efficiency, and market valuation. They aid decision-makers in analyzing business performance, conducting industry comparisons, identifying trends, and making informed investment and financial decisions. Liquidity ratios measure a company's ability to meet short-term financial obligations using its liquid assets. These ratios help evaluate the firm's financial position and ensure it has enough liquidity to operate smoothly. Solvency ratios assess a company's long-term financial stability by examining its debt levels and equity financing. These ratios indicate the company's ability to meet long-term obligations and sustain operations in the long run. Profitability ratios determine a company's financial performance by analyzing its ability to generate profits relative to its sales, assets, or equity. These ratios help stakeholders evaluate the effectiveness of management and the company's overall profitability. Efficiency ratios gauge a company's operational effectiveness by examining how well it manages its assets, inventory, and receivables. These ratios provide insights into the company's operational performance and areas for improvement. Market ratios evaluate a company's market performance, stock valuation, and investor sentiment. These ratios help stakeholders understand the market's perception of the company's financial position and growth potential. The current ratio is calculated as current assets divided by current liabilities. This ratio measures a company's ability to meet short-term obligations using its current assets, such as cash, inventory, and receivables. The quick ratio, also known as the acid-test ratio, is calculated as (current assets - inventory) divided by current liabilities. This ratio excludes inventory from current assets to measure a company's immediate liquidity and its ability to cover short-term obligations without selling inventory. The cash ratio is calculated as cash and cash equivalents divided by current liabilities. This ratio measures a company's ability to meet short-term obligations using only its cash and cash equivalents, providing a conservative assessment of liquidity. The debt ratio is calculated as total liabilities divided by total assets. This ratio measures the proportion of a company's assets financed by debt, indicating its financial leverage and overall risk exposure. The equity ratio is calculated as total equity divided by total assets. This ratio measures the proportion of a company's assets financed by shareholders' equity, providing insights into the company's capital structure and financial stability. The debt-to-equity ratio is calculated as total liabilities divided by total equity. This ratio compares the company's debt financing to equity financing, helping stakeholders assess the company's financial risk and leverage. The interest coverage ratio is calculated as earnings before interest and taxes (EBIT) divided by interest expense. This ratio measures a company's ability to meet interest payments on its debt, indicating the firm's financial stability and risk exposure. The gross margin ratio is calculated as gross profit divided by net sales. This ratio measures the proportion of sales revenue remaining after deducting the cost of goods sold (COGS), indicating the company's gross profitability and pricing strategy effectiveness. The operating margin ratio is calculated as operating income divided by net sales. This ratio measures the proportion of sales revenue remaining after deducting operating expenses, providing insights into the company's operational efficiency and profitability. The net profit margin ratio is calculated as net income divided by net sales. This ratio measures the proportion of sales revenue that translates into net profit, revealing the company's overall profitability and financial performance. The return on assets (ROA) ratio is calculated as net income divided by total assets. This ratio measures how efficiently a company utilizes its assets to generate profit, providing insights into management's effectiveness in deploying resources. The return on equity (ROE) ratio is calculated as net income divided by total equity. This ratio measures the profitability of a company in relation to the equity invested by shareholders, indicating the company's ability to generate returns for its investors. The inventory turnover ratio is calculated as the cost of goods sold divided by average inventory. This ratio measures the number of times a company sells and replaces its inventory during a period, indicating the effectiveness of its inventory management practices. The receivables turnover ratio is calculated as net credit sales divided by average accounts receivable. This ratio measures the number of times a company collects its receivables during a period, providing insights into the efficiency of its credit and collection policies. The payables turnover ratio is calculated as the cost of goods sold divided by average accounts payable. This ratio measures the number of times a company pays its suppliers during a period, reflecting the company's payment efficiency and management of short-term debt. The asset turnover ratio is calculated as net sales divided by total assets. This ratio measures the efficiency with which a company utilizes its assets to generate sales revenue, indicating the overall effectiveness of its asset management practices. The price-to-earnings (P/E) ratio is calculated as the market price per share divided by earnings per share (EPS). This ratio measures the price investors are willing to pay for each dollar of earnings, indicating the market's perception of a company's growth potential and stock valuation. The price-to-sales (P/S) ratio is calculated as the market price per share divided by sales per share. This ratio measures the value investors place on each dollar of a company's revenue, providing insights into the market's assessment of the firm's sales performance and growth prospects. The price-to-book (P/B) ratio is calculated as the market price per share divided by book value per share. This ratio measures the value investors place on each dollar of a company's net assets, offering insights into the market's perception of the firm's underlying asset value and potential for future growth. The dividend yield is calculated as annual dividends per share divided by the market price per share. This ratio measures the return on investment from dividends, providing investors with insights into the income-generating potential of a stock relative to its price. To accurately interpret financial ratios, it is essential to compare them with industry averages. Industry averages provide a context for assessing a company's performance relative to its peers, highlighting strengths and weaknesses in various financial aspects. Analyzing financial ratios over multiple periods helps identify trends and assess the company's progress in achieving its financial goals. Trend analysis provides valuable insights into the firm's historical performance and potential future direction. While financial ratios are essential tools for evaluating a company's financial health and performance, they also have limitations. These limitations include differences in accounting methods, variations in industry norms, and the risk of misinterpretation due to extraordinary events or one-time adjustments. Therefore, it is crucial to use multiple ratios, consider qualitative factors, and exercise caution when interpreting financial ratios. In summary, financial ratios are indispensable tools for evaluating a company's financial health, performance, and market position. These ratios encompass various aspects, including liquidity, solvency, profitability, efficiency, and market valuation. Each category of financial ratios serves a distinct purpose in decision-making, helping businesses, investors, and other stakeholders make informed choices. To effectively interpret financial ratios, it is crucial to compare them with industry averages, conduct trend analysis, and recognize their limitations. By understanding these critical aspects, stakeholders can gain valuable insights into a company's financial position and growth potential. Given the importance of financial ratios and the complexity of interpreting them, it is highly recommended to seek the services of a wealth management professional.Definition and Importance of Financial Ratios
Purpose and Uses of Financial Ratios in Decision-Making
Major Categories of Financial Ratios
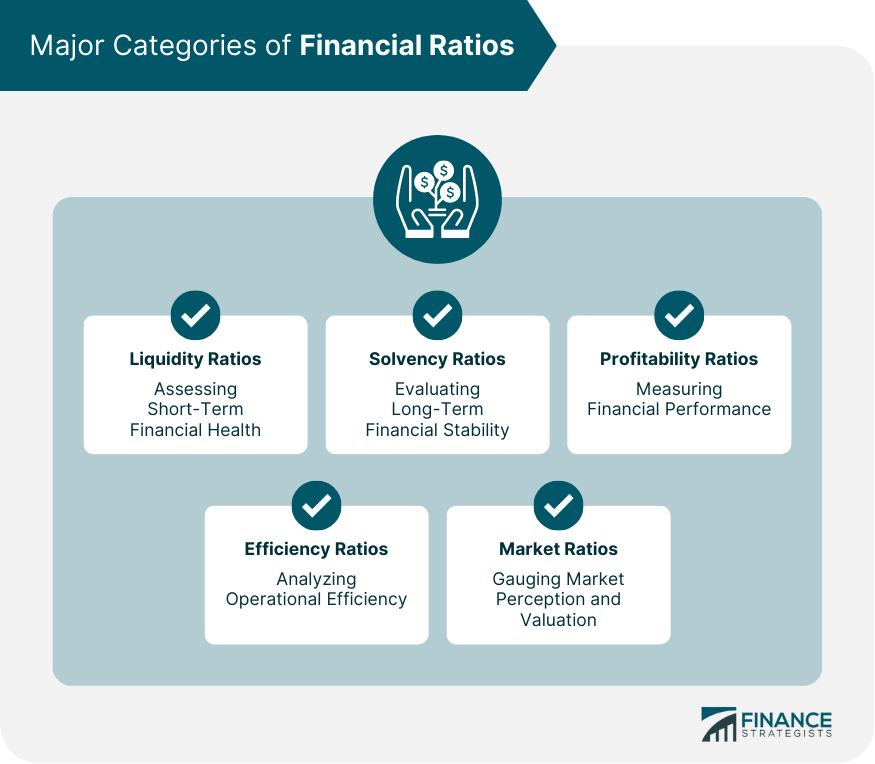
Liquidity Ratios
Solvency Ratios
Profitability Ratios
Efficiency Ratios
Market Ratios
Liquidity Financial Ratios
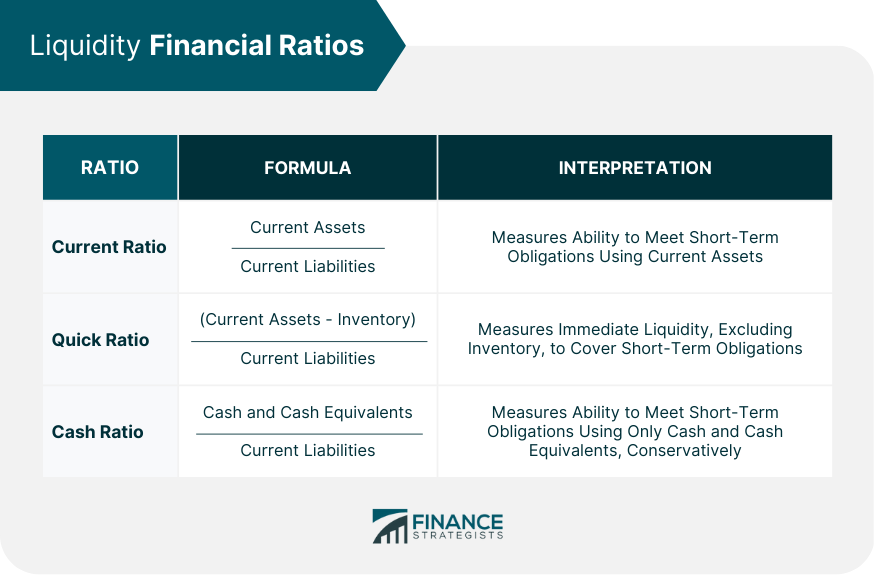
Current Ratio
Quick Ratio (Acid-Test Ratio)
Cash Ratio
Solvency Financial Ratios
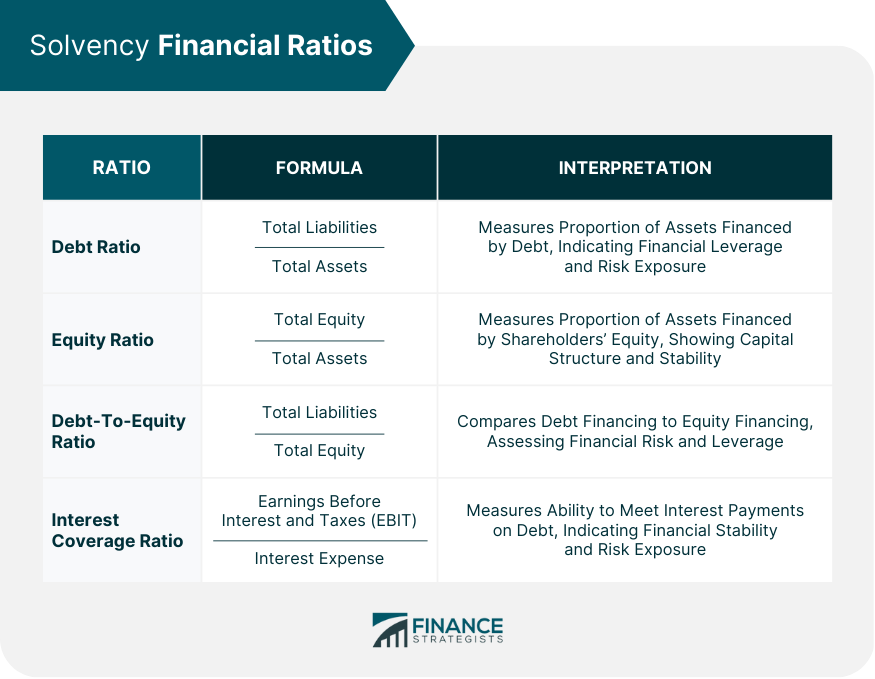
Debt Ratio
Equity Ratio
Debt-To-Equity Ratio
Interest Coverage Ratio
Profitability Financial Ratios
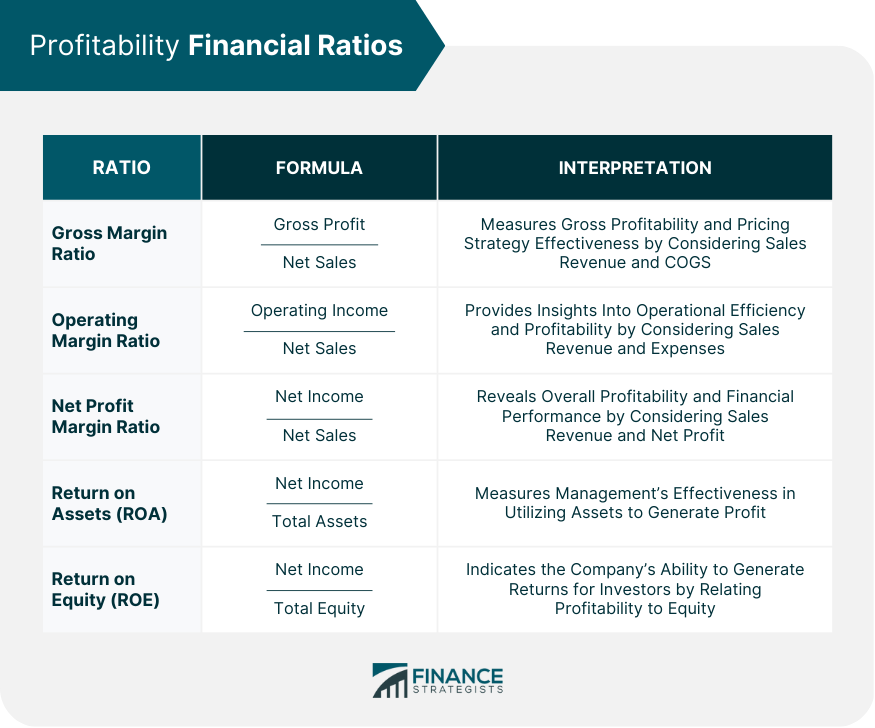
Gross Margin Ratio
Operating Margin Ratio
Net Profit Margin Ratio
Return on Assets (ROA)
Return on Equity (ROE)
Efficiency Financial Ratios
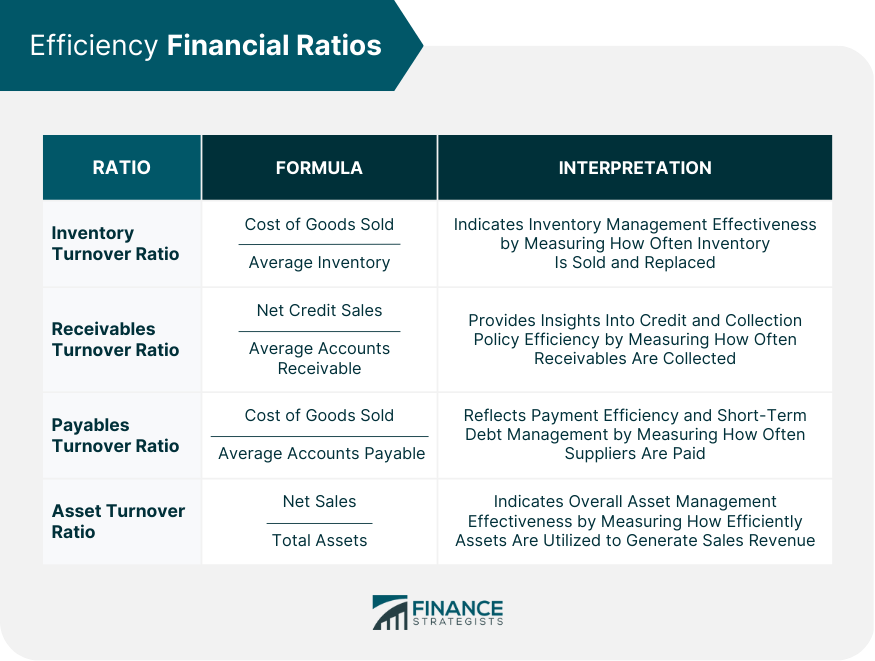
Inventory Turnover Ratio
Receivables Turnover Ratio
Payables Turnover Ratio
Asset Turnover Ratio
Market Financial Ratios
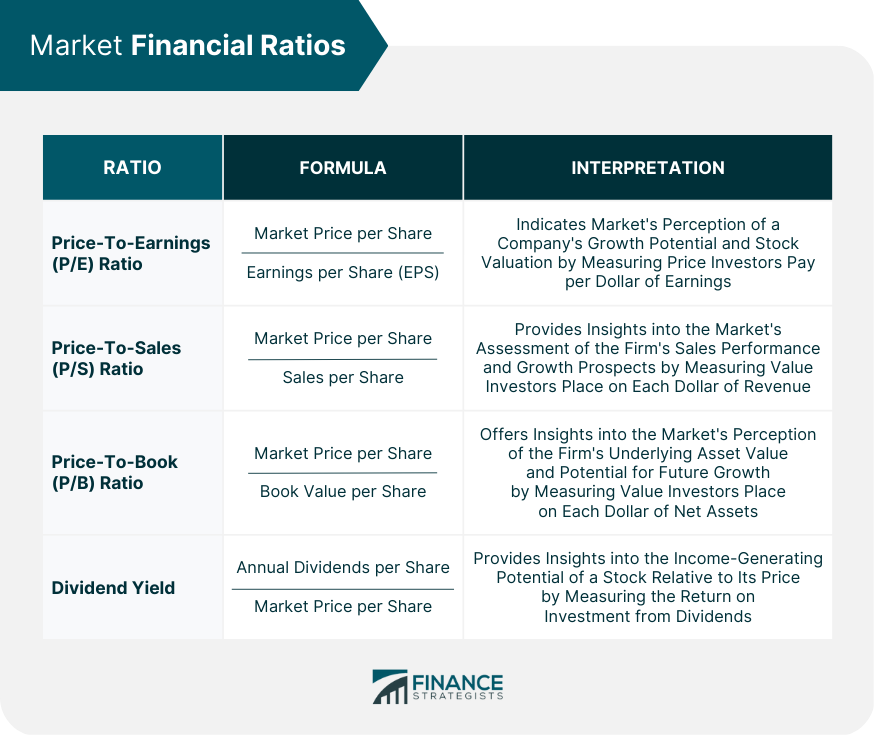
Price-To-Earnings (P/E) Ratio
Price-To-Sales (P/S) Ratio
Price-To-Book (P/B) Ratio
Dividend Yield
Interpreting Financial Ratios: Comparisons and Benchmarks
Industry Averages: Understanding Financial Ratios in Context
Trend Analysis: Evaluating Financial Ratios Over Time
Limitations of Financial Ratios: Cautionary Considerations
Conclusion
Financial Ratios FAQs
Financial ratios are numerical expressions that indicate the relationship between various financial statement items. They are important because they help businesses, investors, and other stakeholders evaluate a company's financial health, performance, and market position, aiding in informed decision-making.
The major categories of financial ratios include liquidity ratios (assessing short-term financial health), solvency ratios (evaluating long-term financial stability), profitability ratios (measuring financial performance), efficiency ratios (analyzing operational efficiency), and market ratios (gauging market perception and valuation).
To compare companies within an industry using financial ratios, you can analyze industry averages, which provide context for assessing a company's performance relative to its peers. By comparing financial ratios across companies, you can identify strengths and weaknesses and make informed investment decisions.
Financial ratios help in trend analysis by revealing patterns and changes in a company's financial performance over multiple periods. By examining these trends, stakeholders can assess the company's progress, identify potential issues, and make necessary adjustments to improve financial health and performance.
Limitations of financial ratios include differences in accounting methods, variations in industry norms, and the risk of misinterpretation due to extraordinary events or one-time adjustments. To address these limitations, use multiple ratios, consider qualitative factors, and exercise caution when interpreting financial ratios. Additionally, consulting a wealth management professional can help you navigate these limitations and make informed decisions.
True Tamplin is a published author, public speaker, CEO of UpDigital, and founder of Finance Strategists.
True is a Certified Educator in Personal Finance (CEPF®), author of The Handy Financial Ratios Guide, a member of the Society for Advancing Business Editing and Writing, contributes to his financial education site, Finance Strategists, and has spoken to various financial communities such as the CFA Institute, as well as university students like his Alma mater, Biola University, where he received a bachelor of science in business and data analytics.
To learn more about True, visit his personal website or view his author profiles on Amazon, Nasdaq and Forbes.


