
A breakout refers to a scenario where the price of a stock or other investment vehicle breaks through a previously defined support or resistance level with increased volume. These support and resistance levels, often established through technical analysis, serve as psychological barriers in the minds of traders and investors, guiding their buying and selling decisions. A breach of these levels signifies a potential market sentiment shift, often resulting in significant price fluctuations. Breakouts are critical because they offer insights into market psychology and possible changes in supply and demand. Traders and investors utilize breakouts to spot substantial profit opportunities and define risk levels by setting clear stop-loss orders. The basic principle behind a breakout lies in the fundamental law of supply and demand. When the price of a stock or another asset moves above a resistance level or below a support level on significant volume, it indicates a shift in the supply and demand balance. When demand exceeds supply, as in the case of a bullish breakout, prices are driven upwards. Conversely, when supply exceeds demand, as in a bearish breakout, prices move downwards. A breakout occurs under specific conditions. Firstly, there must be an established level of support or resistance. Secondly, the price of the asset must move beyond this level, indicating a shift in the balance of supply and demand. Finally, the price movement must be accompanied by an increase in trading volume, confirming the strength of the breakout. A bullish breakout occurs when the price of an asset moves above a resistance level. This indicates that buying pressure has exceeded selling pressure, leading to an upward movement in price. For instance, if the stock of Company A has been trading below $100 for several months, but then suddenly moves above this level on high volume, it would indicate a bullish breakout. Contrarily, a bearish breakout happens when the price of an asset moves below a support level. This implies that selling pressure has overtaken buying pressure, causing a downward price movement. If the same Company A’s stock, which had been trading above $80, suddenly dips below this level on high volume, it would represent a bearish breakout. A continuation breakout occurs when the price of an asset breaks through a resistance level in an uptrend or a support level in a downtrend, signaling that the existing trend will continue. For instance, in a bullish trend, a continuation breakout may occur when the stock price breaks through the previous high on strong volume. A reversal breakout, on the other hand, happens when the price of an asset breaks through a support level in an uptrend or a resistance level in a downtrend, indicating a possible trend reversal. For example, in a bearish trend, a reversal breakout may occur when the stock price rises through the previous low on strong volume. Earnings reports can have a significant impact on breakouts. Positive earnings surprises can lead to a bullish breakout, as investors rush to buy the stock, driving up its price. Similarly, negative earnings surprises can trigger a bearish breakout, with investors selling off the stock and pushing its price lower. Economic data releases, such as GDP figures, unemployment rates, or interest rate announcements, can also lead to breakouts. For instance, stronger than expected economic growth figures can spur bullish breakouts, as they may signal future corporate profitability and lead to increased buying activity. On the other hand, disappointing economic data can result in bearish breakouts, as they may indicate future economic slowdown and trigger selling activity. Market sentiment is a critical factor in breakouts. Bullish sentiment, driven by positive news or optimistic market expectations, can lead to bullish breakouts, while bearish sentiment can result in bearish breakouts. For example, positive news about a vaccine breakthrough can lead to a bullish breakout in pharmaceutical stocks, while negative news about increased regulatory scrutiny can trigger a bearish breakout in tech stocks. Technical analysis is a crucial tool for identifying potential breakouts. Traders use various technical indicators, such as trend lines, moving averages, and volume indicators, to identify support and resistance levels and predict potential breakouts. For example, a stock trading above its 200-day moving average might be on the verge of a bullish breakout, while a stock trading below its 200-day moving average could be heading towards a bearish breakout. Price and volume are the two key indicators for identifying breakouts. A significant price move beyond the resistance or support level, accompanied by an increase in volume, generally signals a breakout. Volume acts as a confirmation tool, validating the price move. For example, if the price breaks above the resistance level with a high volume, it is a strong indication of a bullish breakout. Identifying support and resistance levels is crucial to spotting breakouts. These levels are psychological thresholds where the prices have historically bounced back. Breakouts occur when these thresholds are surpassed. Charting software and trend lines can help traders identify these levels. The relevance of a breakout depends largely on the time frame in which it occurs. For instance, a breakout on a daily chart may indicate a move for the next few days, while a breakout on a monthly chart could signify a longer-term trend. Therefore, traders should align their trading strategies with the time frame of the breakout. Moving averages can provide valuable insights for identifying breakouts. When a price moves above a moving average line, it often signifies a bullish breakout, and when it moves below, it indicates a bearish breakout. Both simple and exponential moving averages are commonly used in breakout identification. Entering a trade at the right time is vital in breakout trading. Traders often wait for the price to break the resistance or support level and then confirm the breakout with increased volume before entering a trade. Entry points can be set just beyond the breakout level to capture the likely price move. Stop-loss orders are essential to managing risk during a breakout. A stop-loss order can be set below the breakout level in a bullish breakout or above the breakout level in a bearish breakout to limit potential losses if the price reverses. Traders must have a clear profit-taking strategy during a breakout. This often involves setting a target price level at which to sell the asset. This price level can be determined by measuring the height of the pattern that preceded the breakout and projecting it from the breakout point. Trading options during a breakout can provide additional opportunities. Traders can use call options to profit from a bullish breakout or put options for a bearish breakout. Options can also help manage risk, as the maximum potential loss is limited to the premium paid for the option. The risk/reward ratio is a critical concept in breakout trading. This ratio compares the potential loss (if the price moves against the trade) to the potential gain (if the price moves in the trade's favor). Traders should aim for trades where the potential reward outweighs the potential risk. Position sizing refers to the amount of capital invested in each trade. Proper position sizing can help manage risk in breakout trading. Traders can determine their position size based on their risk tolerance and the risk/reward ratio of the trade. Diversification can help manage risk in breakout trading. This involves spreading investments across various assets to reduce exposure to any single asset. Even within breakout trading, traders can diversify across different sectors, asset classes, and geographic regions. Backtesting involves testing a trading strategy on historical data to evaluate its performance. This can provide valuable insights into the effectiveness of a breakout trading strategy and help identify potential improvements. Backtesting a breakout strategy can provide insights into its potential profitability and risk. However, it has limitations, as past performance does not guarantee future results. Also, backtesting often assumes ideal trading conditions and does not account for slippage, liquidity issues, or changes in market conditions. Chasing a breakout refers to entering a trade after the price has already moved significantly in the breakout direction. This often leads to poor risk/reward ratios and can result in losses if the price reverses. Not all price moves beyond resistance or support levels are breakouts. Sometimes, these can be false breakouts where the price moves beyond the level but quickly reverses. It's essential to confirm a breakout with other indicators, such as volume. Overtrading involves making too many trades, often driven by emotions rather than strategy. Overtrading can lead to excessive trading costs and can amplify losses. While breakouts occur on individual assets, they are influenced by broader market trends and events. Ignoring the broader market context can lead to mistaken trades. For instance, a bullish breakout in an individual stock may fail if the overall market is in a downtrend. A breakout, a significant financial concept, refers to the scenario where a security's price moves beyond a predetermined support or resistance level with increased volume. There are different types of breakouts including bullish, bearish, continuation, and reversal, each having distinct implications on the market. Various factors contribute to breakouts, such as earnings reports, economic data, market sentiment, and technical analysis. Developing successful strategies for trading breakouts involves careful consideration of entry points, setting stop-loss orders, taking profits, and utilizing options. Traders must also be mindful of risk management, understanding the risk/reward ratio, proper position sizing, and the importance of diversification. Given the complexities and risks associated with trading breakouts, it may be beneficial to seek the services of a wealth management professional who can provide expert guidance and support.What Is a Breakout?
Understanding the Concept of Breakouts
Basic Principle
Conditions for a Breakout
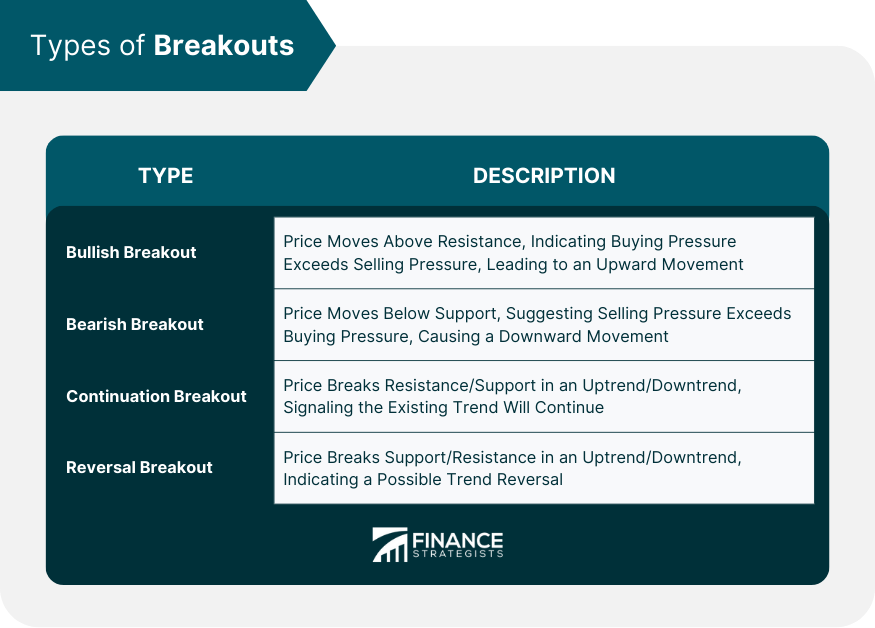
Types of Breakouts
Bullish Breakout
Bearish Breakout
Continuation Breakout
Reversal Breakout
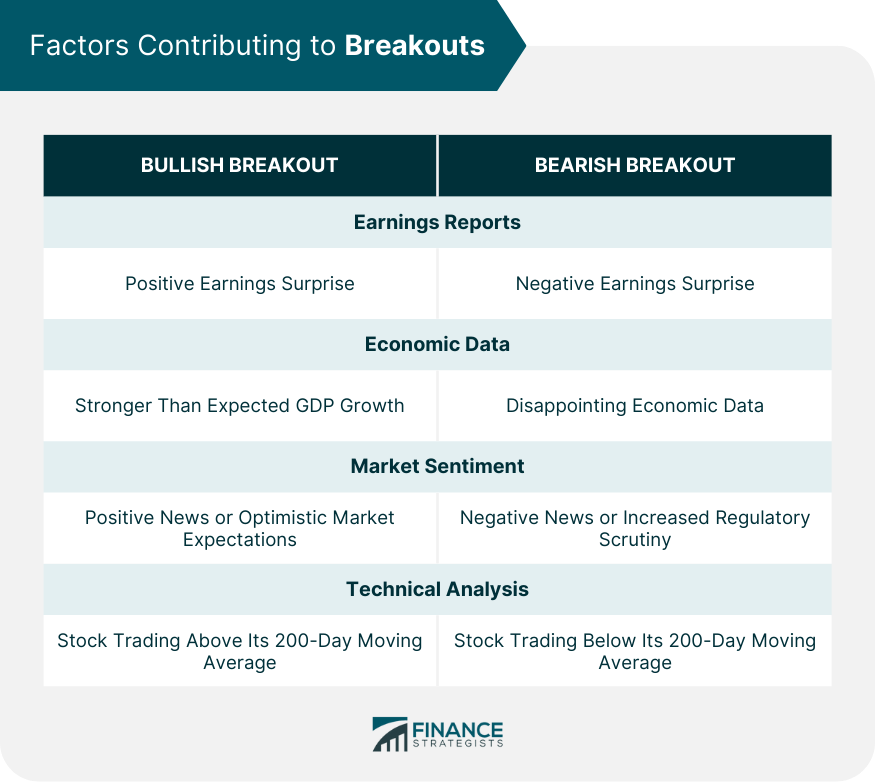
Factors Contributing to Breakouts
Earnings Reports and Breakouts
Economic Data and Breakouts
Market Sentiment and Breakouts
Technical Analysis and Breakouts
Identifying Breakouts
Price and Volume Indicators
Support and Resistance Levels
Time Frames and Breakouts
Role of Moving Averages in Identifying Breakouts
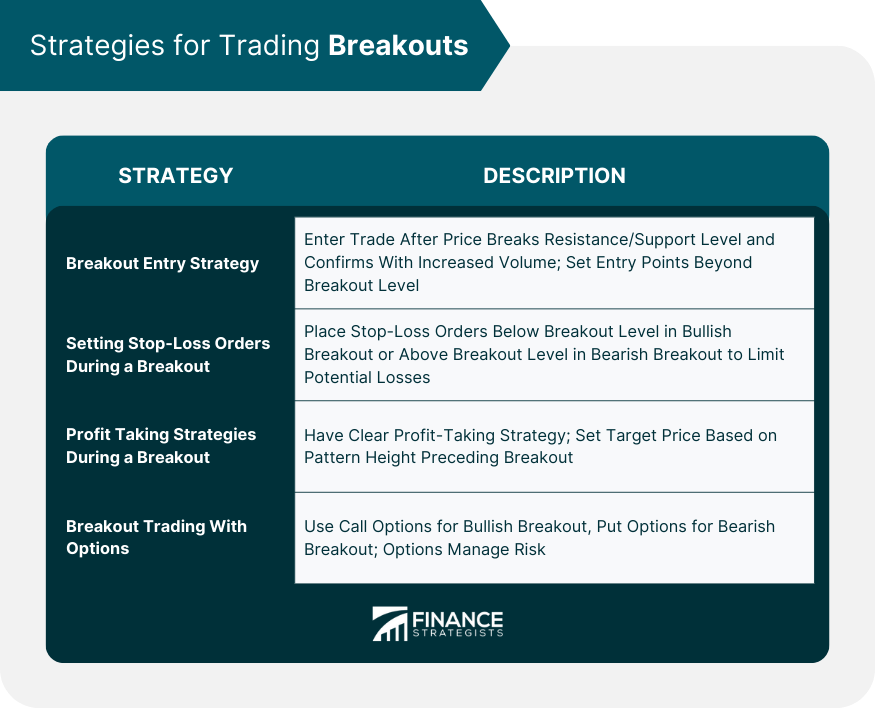
Strategies for Trading Breakouts
Breakout Entry Strategy
Setting Stop-Loss Orders During a Breakout
Profit Taking Strategies During a Breakout
Breakout Trading With Options
Risk Management in Breakout Trading
Understanding Risk/Reward Ratio in Breakout Trading
Position Sizing and Breakouts
Importance of Diversification in Breakout Trading
Role of Backtesting in Breakout Trading
Understanding Backtesting
Benefits and Limitations of Backtesting a Breakout Strategy
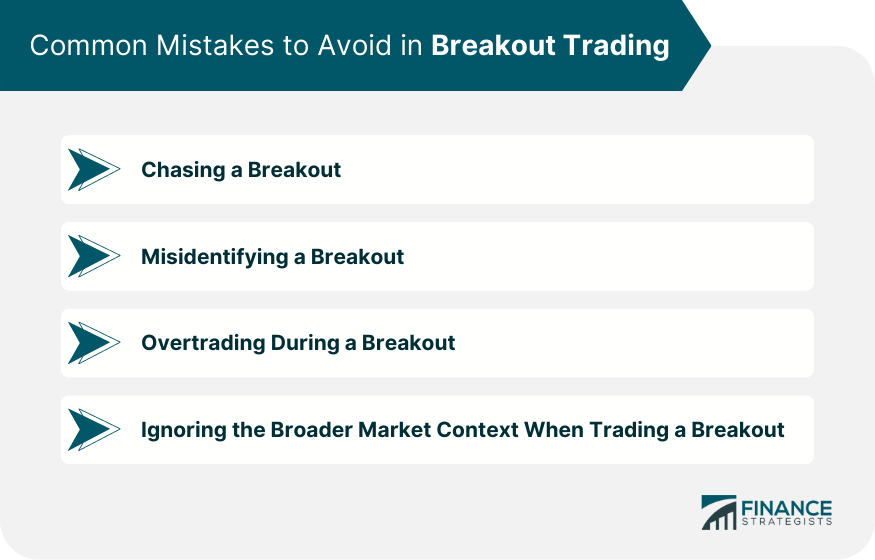
Common Mistakes to Avoid in Breakout Trading
Chasing a Breakout
Misidentifying a Breakout
Overtrading During a Breakout
Ignoring the Broader Market Context When Trading a Breakout
Final Thoughts
Breakouts FAQs
A breakout in finance refers to a situation where the price of a security, such as a stock or bond, moves beyond a previously established level of support or resistance with increased trading volume.
There are four primary types of breakouts: bullish (price breaks above resistance), bearish (price breaks below support), continuation (price breaks in the direction of the existing trend), and reversal (price breaks against the existing trend).
Earnings reports can trigger breakouts if the reported earnings significantly exceed or fall short of market expectations. Positive surprises can lead to bullish breakouts, while negative surprises can lead to bearish breakouts.
Common strategies for trading breakouts include timely entry at the point of breakout, setting stop-loss orders to manage risk, setting profit targets, and trading options to capitalize on the breakout.
Common mistakes to avoid when trading breakouts include chasing the breakout, misidentifying a breakout, overtrading, and ignoring the broader market context.
True Tamplin is a published author, public speaker, CEO of UpDigital, and founder of Finance Strategists.
True is a Certified Educator in Personal Finance (CEPF®), author of The Handy Financial Ratios Guide, a member of the Society for Advancing Business Editing and Writing, contributes to his financial education site, Finance Strategists, and has spoken to various financial communities such as the CFA Institute, as well as university students like his Alma mater, Biola University, where he received a bachelor of science in business and data analytics.
To learn more about True, visit his personal website or view his author profiles on Amazon, Nasdaq and Forbes.


