
Breadth indicators analyze the health and vibrancy of the stock market by gauging the number of stocks involved in a market trend. They assess the scope or 'breadth' of market activity to determine the power behind market shifts and capture underlying market sentiment. In financial analysis, these indicators are vital as they offer a snapshot of market performance, enabling investors and analysts to discern if a market trend is broadly based and therefore sturdy, or whether it's skewed by a select few entities. By providing early warnings of possible market reversals, breadth indicators prove invaluable for proactive market trend analysis and decision-making. The financial market's structure can be seen as a vast, complex system composed of different types of instruments, including stocks, bonds, derivatives, and commodities, to name a few. It comprises various participants, such as individual investors, institutional investors, brokers, and regulators. All these entities interact in a dynamic environment, where prices fluctuate based on supply and demand principles. In this intricate structure, breadth indicators serve as critical tools to provide a nuanced understanding of the market's direction. Rather than focusing solely on index-level data, like the Dow Jones Industrial Average or S&P 500, they offer a more granular view, taking into account the activity of individual stocks. By doing so, breadth indicators can highlight potential discrepancies between the market index performance and the overall market participation, revealing if a trend is genuinely broad-based or driven by a select few stocks. The Advance-Decline Line is a popular breadth indicator that plots the difference between the number of advancing stocks and declining stocks. A rising AD line indicates broad market participation in an uptrend, while a falling AD line might signal a decline with broad participation. Divergences between the AD line and the market index can provide early signs of potential market reversals. Named after its creator Richard Arms, the Arms Index, also known as the TRIN, is a breadth indicator that compares advancing and declining stocks' relative strength to their respective volumes. An index value below 1 typically suggests bullish sentiment, whereas a value above 1 may indicate bearish sentiment. Traders often use the Arms Index for short-term trading signals. The McClellan Oscillator is a breadth indicator that uses exponential moving averages of advancing and declining issues to identify overbought or oversold conditions in the market. Its derived tool, the McClellan Summation Index, provides a longer-term view of the market's momentum. The High-Low Index compares the number of stocks making 52-week highs to those making 52-week lows. This breadth indicator can provide insights into the long-term trend of the market, with a rising line indicating a bullish market and a falling line indicating a bearish market. This breadth indicator calculates the percentage of stocks trading above a specific moving average, such as the 50-day or 200-day moving average. A high percentage can suggest a strong bullish market, while a low percentage can indicate a bearish market. Breadth indicators can be highly effective tools for identifying market trends. For example, a rising Advance-Decline Line with a rising market index could confirm a bullish trend. Alternatively, if the market index is rising, but the Advance-Decline Line is falling, this negative divergence could indicate that the market uptrend is losing steam and a bearish reversal may be imminent. Breadth indicators are particularly renowned for their ability to signal potential market reversals ahead of time. For instance, if the McClellan Oscillator moves into extreme overbought territory while the market index continues to climb, this could signal a possible market top and subsequent downturn. One common mistake when using breadth indicators is misunderstanding divergence signals. Traders often interpret a divergence as an immediate sell signal, which could potentially lead to premature investment decisions. Many traders mistakenly believe that divergence signals an immediate reversal in the market. However, divergences can persist for extended periods before a reversal actually occurs, and acting prematurely could lead to unnecessary losses. Before acting on a divergence signal, it is essential to seek confirmation through other indicators or market analysis. Neglecting to do so can lead to false interpretations and potentially costly decisions. Another prevalent mistake is the isolated use of breadth indicators. This approach can lead to skewed or inaccurate market predictions as breadth indicators should be used in conjunction with other forms of analysis. Technical analysis uses statistical trends gathered from trading activity, such as price movement and volume, to predict future market movements. Breadth indicators can provide valuable information about market sentiment, but failing to use them alongside technical analysis can lead to incomplete market insights. Fundamental analysis involves evaluating a security's intrinsic value by examining related economic and financial factors. While breadth indicators can provide a sense of market direction, ignoring fundamental analysis can result in an incomplete understanding of market forces and potential misjudgment of investment opportunities. Many traders become overly reliant on a single breadth indicator, which can result in a narrow perspective of the market. It's crucial to use a range of indicators to form a comprehensive understanding of market conditions. Each breadth indicator provides unique insights into market conditions, and ignoring others can result in an incomplete picture. Diversifying the breadth indicators used can help to provide a more rounded understanding of the market. The relevance of certain breadth indicators can change over time due to shifts in market conditions. Traders who fail to regularly review and adjust their selection of indicators may find that their analysis becomes less accurate over time. While breadth indicators focus on the number of stocks participating in a market trend, other technical analysis tools, like momentum indicators or trend-following indicators, focus on different market aspects. For example, momentum indicators such as the Relative Strength Index (RSI) measure the speed and change of price movements, while trend-following indicators like Moving Averages smooth price data to help traders identify market trends. For a more comprehensive view of the market, combining breadth indicators with other technical analysis tools can be beneficial. For example, using the Advance-Decline Line for understanding market participation alongside RSI for momentum can provide a more rounded view of the market's overall health and direction. Breadth indicators track the number of stocks involved in a market trend, offering insights into the overall market health. Various types, such as the Advance-Decline Line and the Percentage of Stocks Above a Specific Moving Average, can highlight market trends and potential reversals. However, their accuracy may be impacted by factors like data accuracy, market volatility, and the chosen analysis timeframe. Misinterpreting these signals or using them without considering the broader financial context can lead to errors. Breadth indicators should be part of a diverse trading strategy that includes other technical and fundamental analysis tools. Mastering them takes time and experience, and individuals may benefit from professional help. Wealth management services could offer valuable guidance to optimize trading decisions and maximize wealth, leveraging breadth indicators and other trading tools effectively.What Is a Breadth Indicator?
Overview of the Financial Market and Breadth Indicators
Structure of the Financial Market
Role of Breadth Indicators in the Financial Market
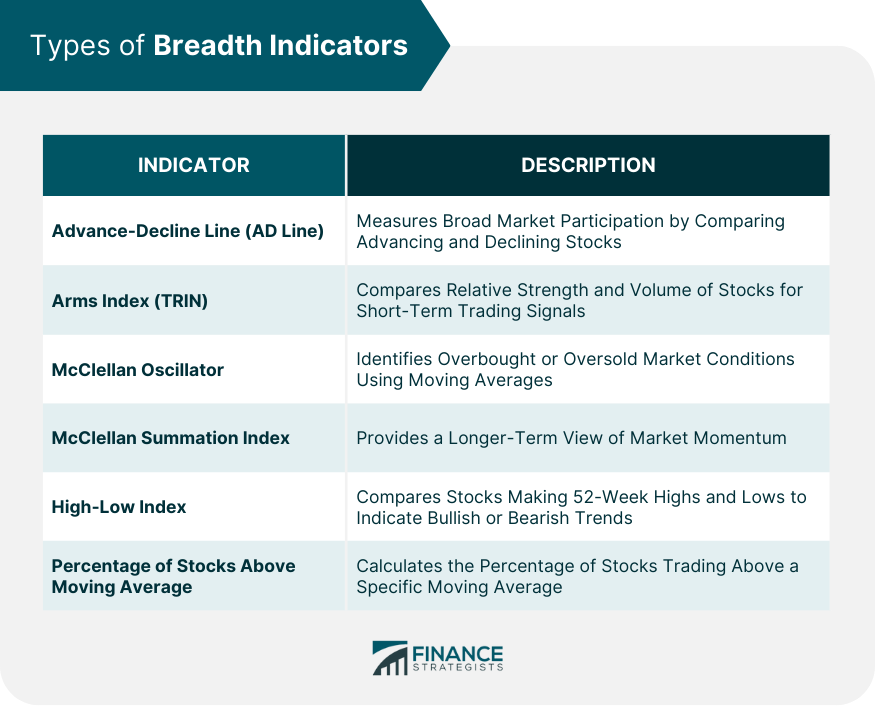
Types of Breadth Indicators
Advance-Decline Line (AD Line)
Arms Index (TRIN)
McClellan Oscillator and McClellan Summation Index
High-Low Index
Percentage of Stocks Above a Specific Moving Average
Using Breadth Indicators for Trading Decisions
Identifying Market Trends With Breadth Indicators
Recognizing Market Reversals With Breadth Indicators
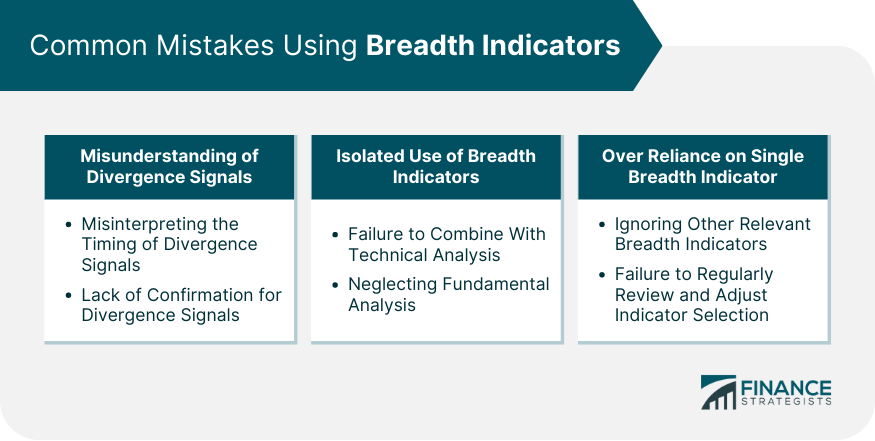
Common Mistakes When Using Breadth Indicators
Misunderstanding of Divergence Signals
Misinterpreting the Timing of Divergence Signals
Lack of Confirmation for Divergence Signals
Isolated Use of Breadth Indicators
Failure to Combine With Technical Analysis
Neglecting Fundamental Analysis
Over Reliance on Single Breadth Indicator
Ignoring Other Relevant Breadth Indicators
Failure to Regularly Review and Adjust Indicator Selection
Breadth Indicators and Other Technical Analysis Tools
Comparing Breadth Indicators With Other Indicators
Combining Breadth Indicators With Other Technical Analysis Tools
Final Thoughts
Breadth Indicator FAQs
Breadth indicators are technical analysis tools that measure the number of stocks participating in a market trend, providing insights into the health and vitality of the market.
Breadth indicators help identify market trends and potential reversals, aiding in proactive decision-making. They can reveal whether a market movement is broad-based or driven by a few entities.
Common breadth indicators include the Advance-Decline Line, Arms Index (TRIN), McClellan Oscillator and Summation Index, High-Low Index, and the Percentage of Stocks Above a Specific Moving Average.
Breadth indicators can be influenced by data accuracy, market volatility, and the selected time frame. Misinterpretation of their signals can lead to mistakes, and they should not be used in isolation without considering other technical and fundamental factors.
With technological advances, breadth indicators are increasingly integrated into algorithmic trading systems. These systems automate the analysis and trading process, using signals from breadth indicators to enhance trading strategies.
True Tamplin is a published author, public speaker, CEO of UpDigital, and founder of Finance Strategists.
True is a Certified Educator in Personal Finance (CEPF®), author of The Handy Financial Ratios Guide, a member of the Society for Advancing Business Editing and Writing, contributes to his financial education site, Finance Strategists, and has spoken to various financial communities such as the CFA Institute, as well as university students like his Alma mater, Biola University, where he received a bachelor of science in business and data analytics.
To learn more about True, visit his personal website or view his author profiles on Amazon, Nasdaq and Forbes.


