
A Hanging Man Candlestick is a bearish chart pattern used in technical analysis that potentially indicates a market reversal. It is characterized by a small body at the upper end of the candle and a long lower wick, at least twice the length of the body. The pattern resembles the shape of a man hanging from a rope. The Hanging Man Candlestick typically appears at the end of an uptrend, signaling that selling pressure may be increasing and a bearish reversal might be imminent. However, it requires confirmation from subsequent candles to validate this potential change in direction. The color of the body, either green (bullish) or red (bearish), can provide additional information about the strength of the reversal signal. Originating from centuries-old Japanese rice trading, the Hanging Man Candlestick concept, a method for predicting price movements, has evolved and is now globally integrated into modern stock and forex trading. A Hanging Man Candlestick appears during an uptrend, and it signifies that selling pressure may be increasing. Structurally, it has a small body at the top, a minimal or no upper wick, and a long lower wick. The lower wick is typically at least twice the size of the body. While similar to the Hammer, the Hanging Man appears at the top of an uptrend, unlike the Hammer, which appears at the bottom of a downtrend. Both have a small body and a long lower wick, but their location in the trend makes the difference in interpretation. The Hanging Man is often compared with other bearish reversal patterns, such as the Shooting Star and Doji. The color of the Hanging Man's body can add depth to its interpretation. A red (or black) body signifies that the close was lower than the open, indicating stronger selling pressure. A green (or white) body, where the close is higher than the open, still implies a potential bearish reversal, but the signal may be weaker. The appearance of a Hanging Man during an uptrend signals that sellers are starting to enter the market, which may lead to a price decline. This pattern is viewed as a potential bearish reversal signal. Confirmation is a critical concept in candlestick pattern analysis. For the Hanging Man, confirmation is typically seen in the form of a lower closing on the next trading period, signifying that the bearish reversal is underway. The primary differentiation between a Hanging Man and a Hammer lies in their location within the trend. A Hanging Man occurs during an uptrend and signals a possible reversal to a downtrend. Conversely, a Hammer forms during a downtrend and hints at a potential upward reversal. The Hanging Man can provide traders with an early indication of a potential trend reversal. Acting as a warning sign, it allows traders to prepare for possible price declines and adjust their strategies accordingly. In the context of the Hanging Man, a preceding uptrend and an increase in volume during the formation of the pattern can strengthen the bearish reversal signal. Higher volume reflects increased trading activity, reinforcing the validity of the pattern. The Hanging Man reflects a shift in market psychology. It signifies that, despite the uptrend, sellers are beginning to outperform buyers, possibly leading to a trend reversal. It's a sign of increasing selling pressure. Day traders often use the Hanging Man to identify short-term trend reversals. When spotted, they might consider exiting long positions or entering short ones, depending on other technical indicators and the overall market context. Swing traders, who hold positions for days to weeks, can use the Hanging Man to anticipate potential price swings. If other technical conditions align, they might take this as a sign to exit long positions or enter short trades. The Hanging Man can be used as part of a broader trading strategy, often in conjunction with other technical indicators like moving averages or Relative Strength Index (RSI) for confirmation. For example, traders might wait for an RSI divergence or a moving average crossover for added confirmation of a bearish reversal. Like all technical indicators, the Hanging Man is not foolproof. It merely suggests a potential reversal, not guarantees one. False signals can occur, so it's essential to use stop-loss orders and risk management strategies to protect against potential losses. The Hanging Man and Hammer are both candlestick patterns, characterized by small bodies and long lower shadows. The Hammer signals a bullish reversal after a downtrend, while the Hanging Man is bearish, indicating a potential reversal at the end of an uptrend, hinting at forthcoming price drops. The Inverted Hammer, like the Hanging Man, has a small body and a long upper wick. However, it appears during a downtrend and signals a potential bullish reversal, the exact opposite of the Hanging Man. The Shooting Star is a bearish reversal pattern that also appears during an uptrend. Unlike the Hanging Man, which has a long lower wick, the Shooting Star has a small body at the lower end and a long upper wick. The Hanging Man can be used in tandem with other technical indicators like trendlines, moving averages, or oscillators. This can provide added confirmation of a reversal, improving the reliability of the signal. The Hanging Man can also form part of more complex, multi-candlestick patterns. For instance, if followed by a gap down and a bearish candle, it forms part of an Evening Star pattern, a powerful bearish reversal signal. While the Hanging Man is a widely recognized pattern, its effectiveness can vary. The Hanging Man Candlestick, an ominous signal in technical analysis, indicates a potential bearish market reversal. This pattern, originating from traditional Japanese rice trading, is defined by a compact body positioned at the upper end and a lengthy lower wick. These characteristics suggest a surge in selling pressure. Its position during an uptrend differentiates it from similar patterns like the Hammer. The color of the Hanging Man's body – red for strong selling pressure and green for weaker reversal signals – enhances its interpretation. Confirmation from subsequent trading periods is crucial for its validity. Traders use this pattern in the day and swing trading to anticipate short-term reversals and medium-term price swings, respectively. It's also incorporated with other technical indicators for comprehensive strategies. Despite its utility, traders must consider its limitations and implement risk management strategies. The Hanging Man is more than just a pattern – it embodies shifting market psychology, making it a valuable tool for predicting future price trends.Definition of Hanging Man Candlestick
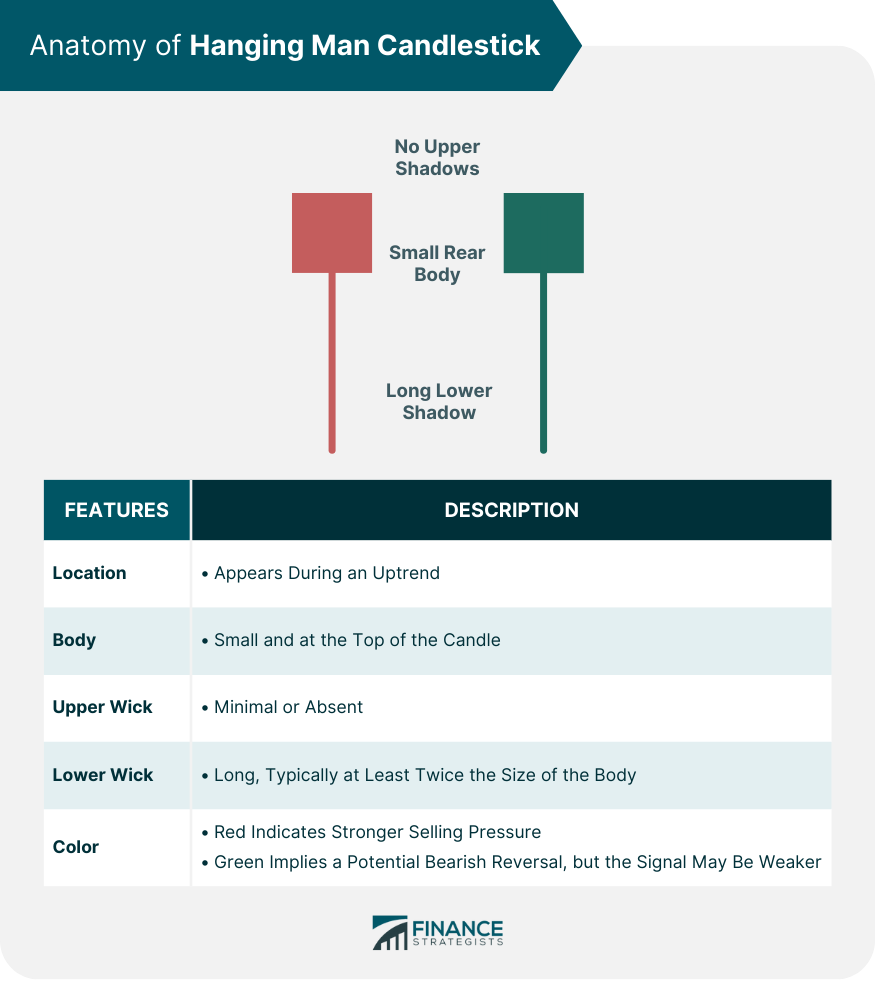
Anatomy of Hanging Man Candlestick
Structural Description
Comparison With Other Candlestick Patterns
Significance of the Color of the Hanging Man Candlestick
Interpretation of Hanging Man Candlestick
What Hanging Man Signifies in an Uptrend
The Concept of Confirmation
Differentiating Between a Hanging Man and a Hammer
Importance of Hanging Man Candlestick in Technical Analysis
How It Helps in Predicting Market Trends
Importance of Volume and Preceding Price Trend
Role in Understanding Market Psychology
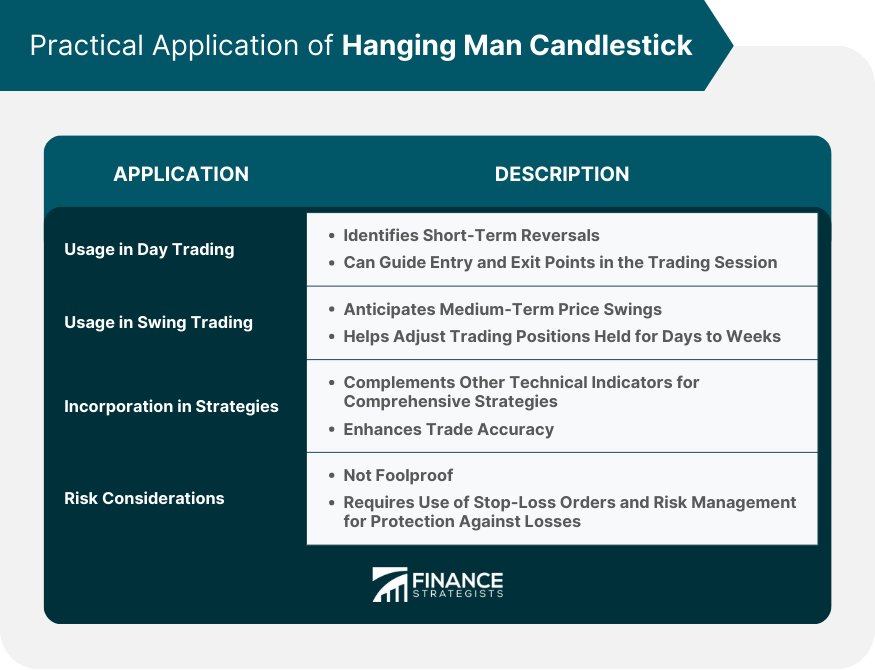
Practical Application of Hanging Man Candlestick
Usage in Day Trading
Usage in Swing Trading
Incorporation in Trading Strategies
Limitations and Risk Considerations
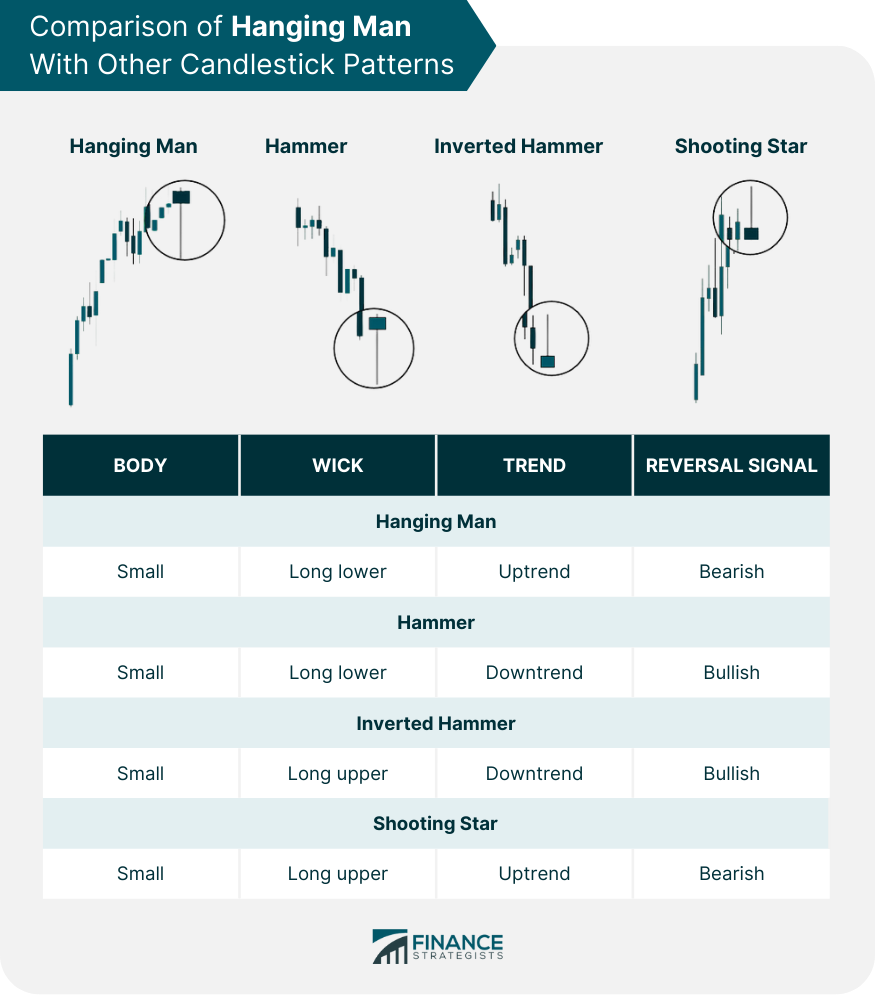
Comparison With Other Candlestick Patterns
Hanging Man vs Hammer
Hanging Man vs Inverted Hammer
Hanging Man vs Shooting Star
Advanced Concepts Involving Hanging Man Candlestick
Usage in Combination With Other Technical Indicators
Role in Multi-Candlestick Patterns
Statistical Validity of Hanging Man as a Trend Reversal Indicator
Statistical analysis of historical market data can provide insights into the pattern's success rate, although its predictive power will also depend on the market conditions and the specific security being traded.Conclusion
Hanging Man Candlestick FAQs
A Hanging Man Candlestick is a chart pattern in technical analysis that signals a potential bearish reversal. It resembles a man hanging from a rope, featuring a small upper body and a long lower wick, and typically appears during an uptrend.
A Hanging Man Candlestick suggests that selling pressure may be increasing, indicating a possible trend reversal from bullish to bearish. Confirmation, typically a lower closing in the next trading period, strengthens this signal.
Both patterns have similar structures but appear in different trend contexts. A Hanging Man Candlestick emerges during an uptrend and may signal a bearish reversal, while a Hammer Candlestick appears in a downtrend, signifying a potential bullish reversal.
Yes, combining the Hanging Man Candlestick with other technical indicators, such as moving averages or the Relative Strength Index (RSI), can provide additional confirmation of a potential reversal, thereby improving the accuracy of trading decisions.
While the Hanging Man Candlestick can provide an early warning of a potential market reversal, it is not always accurate. False signals can occur, so they should be used as part of a comprehensive trading strategy, including risk management techniques and other technical indicators.
True Tamplin is a published author, public speaker, CEO of UpDigital, and founder of Finance Strategists.
True is a Certified Educator in Personal Finance (CEPF®), author of The Handy Financial Ratios Guide, a member of the Society for Advancing Business Editing and Writing, contributes to his financial education site, Finance Strategists, and has spoken to various financial communities such as the CFA Institute, as well as university students like his Alma mater, Biola University, where he received a bachelor of science in business and data analytics.
To learn more about True, visit his personal website or view his author profiles on Amazon, Nasdaq and Forbes.


