
The impulse wave pattern is a pattern that signifies a strong price movement in the direction of the overall market trend. The impulse wave pattern typically consists of five waves—three of them are motive (or in the direction of the main trend) and two are corrective (or against the trend). These waves are numbered 1, 2, 3, 4, and 5 respectively, where waves 1, 3, and 5 are the motive waves, and waves 2 and 4 are corrective. The impulse wave pattern is a key element of the Elliott Wave Theory, developed by professional accountant Ralph Nelson Elliott in the 1930s. Contrary to the belief that stock markets behave chaotically, Elliott discovered that they exhibit repetitive wave patterns, resulting from investors' responses to external factors or prevalent collective psychology. Thus, the impulse wave pattern became a cornerstone of this theory. The essence of the Impulse Wave Pattern lies in the unique five-wave structure, which forms the basis of the Elliott Wave theory. This structure consists of five distinct waves - each demonstrating a specific characteristic in price action, trend, and momentum. The first wave, often overshadowed by the prevailing market trend, is the initial move that signals a potential trend shift. It might be challenging to identify because it blends into the existing market movement, making it seem inconsequential. The first wave is the catalyst, initiating the larger trend that unfolds in the following waves. Following the first wave, wave 2 serves as the correction phase. This wave pulls back, or retraces, a portion of the initial wave, usually retracing up to 61.8% of the first wave's movement. However, this retracement can sometimes reach a deeper level, extending to as much as 78.6% of the initial wave. This wave appears as a reversal of the trend initiated by wave 1, but it's merely a pause before the main action unfolds. The third wave is typically the most robust and longest in the five-wave sequence. It manifests as a strong price movement in the direction of the new trend that started with wave 1. This wave is usually the most profitable, as it reflects the market's acceptance of a new trend and is driven by substantial momentum and volume. Wave 4, just like wave 2, is a corrective phase. However, it is usually less severe than wave 2 and presents more complex correction patterns. The market's momentum during this wave is usually subdued, and it doesn't retrace more than 38.2% of wave 3, ensuring the underlying trend remains intact. The fifth and final wave marks the last substantial move in the direction of the prevailing trend. Despite moving in the trend's direction, wave 5 often lacks the vigor of the third wave. It concludes the five-wave cycle, but it's usually accompanied by price divergence in momentum indicators, hinting at a forthcoming trend reversal. This divergence suggests a weakening trend and sets the stage for a more significant corrective phase. An impulse wave pattern is a valuable tool for recognizing long-term price movements. For example, if an analyst identifies an impulse wave pattern within an uptrend, they could project that the uptrend will continue for a more extended period. This is because the third wave in an impulse pattern is often the longest and most powerful, indicating strong buying pressure. Impulse wave patterns can also help predict potential reversal points. This is particularly relevant at the end of the fifth wave, where the trend has typically exhausted its momentum. A reversal may take the form of a three-wave correction pattern, according to the Elliott Wave Theory. Traders also use the impulse wave pattern for risk management. For instance, if a trader assumes a long position during an uptrend, identifying the start of wave 2 or 4 can help them manage their positions to avoid the temporary drawdown that could occur during these corrective waves. Similarly, identifying the fifth wave's completion may prompt a trader to close their long position and potentially switch to a short position to profit from the anticipated correction. In an uptrend, the impulse wave pattern manifests as a strong upward movement followed by smaller downward retracements. The first wave sees prices rising, often without drawing much attention. After reaching a peak, prices retrace to create the second wave. The third wave is then a robust upward move, usually surpassing the peak of the first wave. After reaching the third wave peak, prices retrace again, forming the fourth wave, which doesn't typically fall below the first wave peak. The fifth and final wave sees another upward move before an overall trend reversal occurs. When observing an impulse wave pattern during an uptrend, traders could potentially leverage the following strategies. After identifying the first wave, they could take a long position at the end of the second wave's corrective move, betting on a strong third wave. Another opportunity arises at the end of the fourth wave's correction, where a trader could once again assume a long position, anticipating the fifth wave's advance. One key to this strategy is ensuring proper risk management, as trading based on the Elliott Wave Theory can be subjective, and misidentifying wave patterns can lead to losses. Therefore, setting stop losses and profit targets according to one's risk tolerance is vital. Also, traders should be aware of potential trend reversals after the fifth wave, where they could exit their long positions and, depending on their strategy and market conditions, potentially enter a short position to profit from the ensuing corrective phase. In a downtrend, the impulse wave pattern operates in the same five-wave structure as in an uptrend, but the overall movement is downwards. The first wave involves a sharp price drop, followed by a partial retracement upward for the second wave. The third wave then witnesses another significant downward price movement, typically surpassing the lowest point of the first wave. The fourth wave presents another upward retracement, which typically does not exceed the highest point of the first wave. Lastly, the fifth wave involves a final push downward before a possible trend reversal occurs. In the context of a downtrend, traders can use the impulse wave pattern to potentially profit from falling prices. After recognizing the end of the second wave's retracement, traders might initiate a short position, capitalizing on the anticipated third wave drop. Similarly, at the end of the fourth wave, they could open another short position, expecting the final fifth wave decline. Again, proper risk management is crucial. Traders must set appropriate stop losses and profit targets to manage potential risks. Furthermore, after the completion of the fifth wave, traders could consider closing their short positions and potentially going long, expecting the corrective wave pattern that usually follows. One of the main limitations of using impulse wave patterns in trading is the difficulty in identifying them in real-time. It often requires a significant degree of skill and experience to accurately spot these patterns, as many other market factors can complicate the analysis. The interpretation of impulse wave patterns also depends greatly on the analyst's subjectivity. Different traders may interpret the same price data differently, leading to various trading decisions. This subjectivity can sometimes result in misjudgments and trading errors. Like any other trading tool, impulse wave patterns can occasionally produce false signals. For instance, a trader may misidentify a pattern and make a trade based on an expected price movement that does not materialize, leading to potential losses. The impulse wave pattern, a key concept in Elliott Wave Theory, offers insights into price movements in financial markets. This five-wave structure can help traders predict market trends, providing potential opportunities during both uptrends and downtrends. It's particularly valuable for signaling significant price changes and potential reversal points, aiding in strategic trading decisions. However, identifying this pattern in real-time can be challenging due to its complexity and the high degree of analyst subjectivity it requires, leading to varied interpretations. Like any trading tool, it's prone to false signals, which could cause misjudgments and losses. Given these complexities, professional guidance is advisable when navigating financial markets. If interested, consider seeking wealth management services for expert advice and insights.What Is an Impulse Wave Pattern?
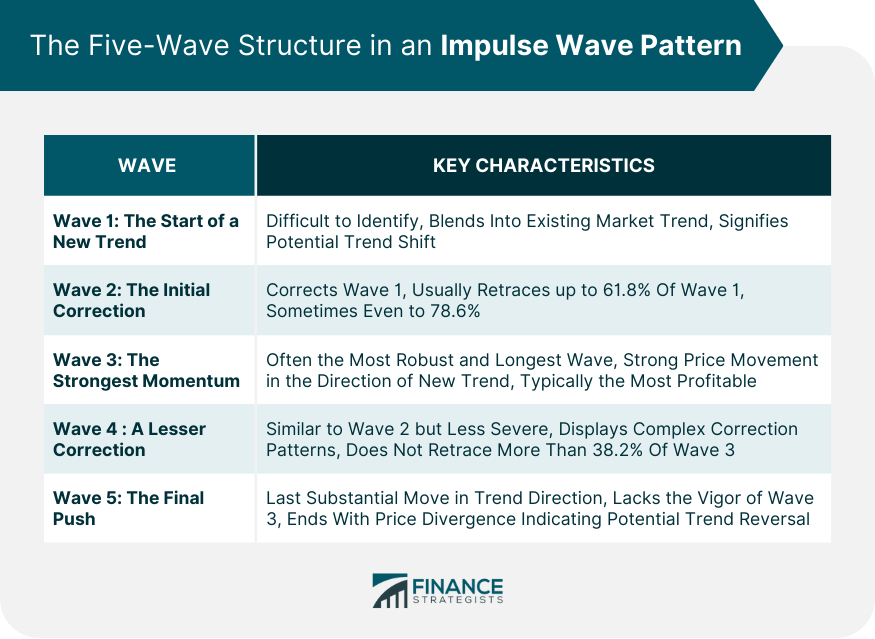
Five-Wave Structure in an Impulse Wave Pattern
Wave 1: The Start of a New Trend
Wave 2: The Initial Correction
Wave 3: The Strongest Momentum
Wave 4: A Lesser Correction
Wave 5: The Final Push
Importance of Impulse Wave Patterns in Financial Analysis
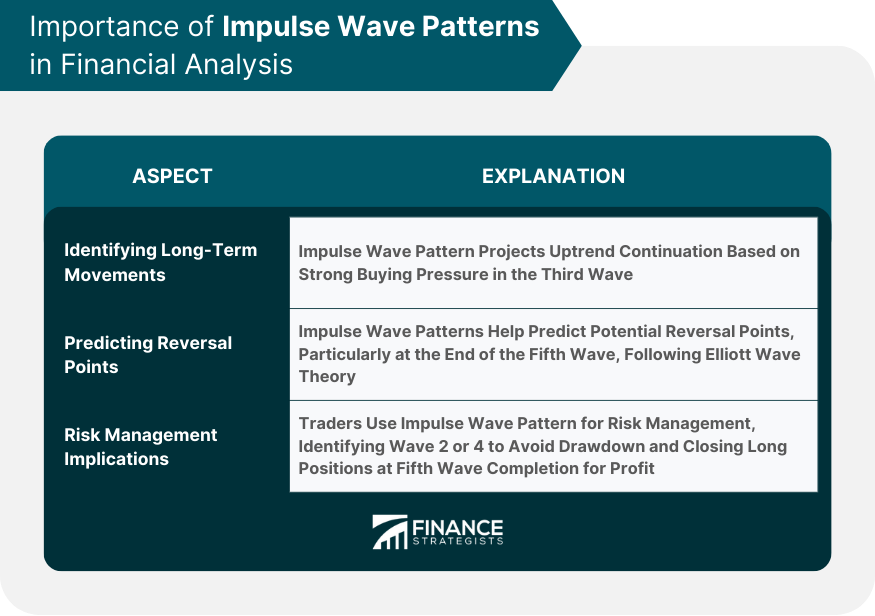
Identifying Long-Term Price Movements
Predicting Potential Reversal Points
Risk Management Implications of Impulse Wave Patterns
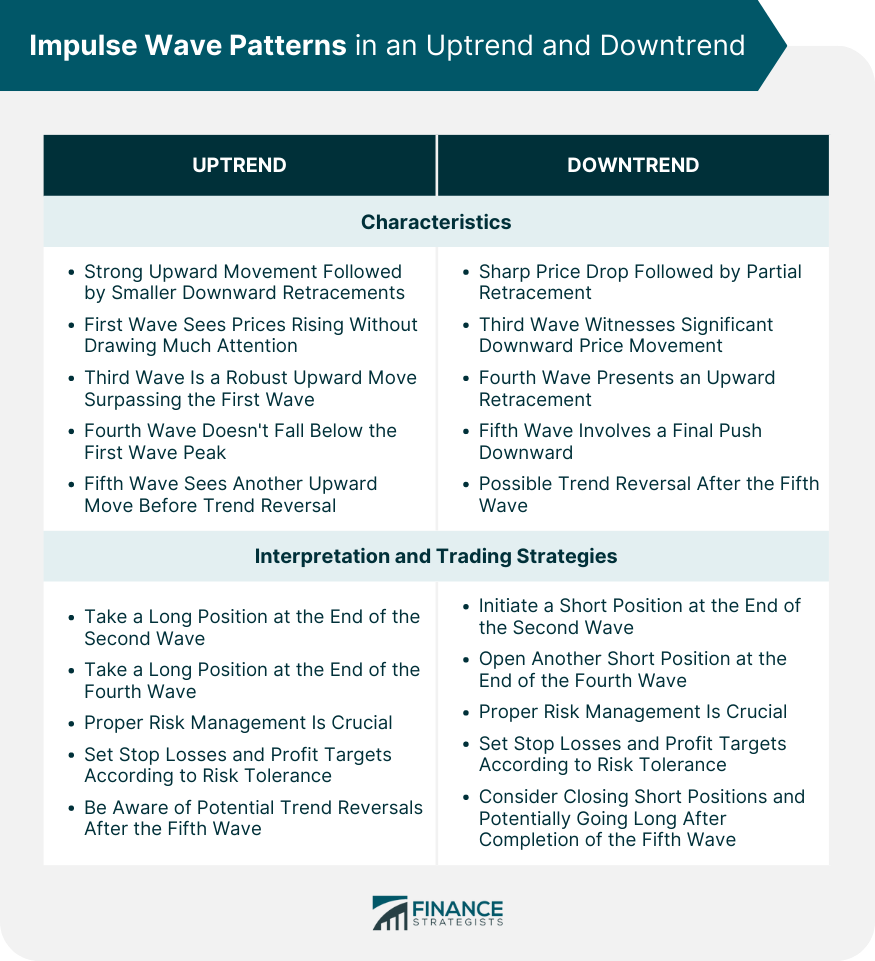
Impulse Wave Patterns in an Uptrend
Characteristics and Identification
Interpretation and Trading Strategies
Impulse Wave Patterns in a Downtrend
Characteristics and Identification
Interpretation and Trading Strategies
Limitations of Impulse Wave Pattern Analysis
Challenges in Identifying Impulse Wave Patterns
Dependence on the Subjectivity of the Analyst
Risk of False Signals
Final Thoughts
Impulse Wave Pattern FAQs
An impulse wave pattern is a term from the Elliott Wave Theory that describes a strong price movement in the direction of the underlying trend, characterized by a five-wave structure.
Traders use the impulse wave pattern to anticipate future price movements, identifying potential entry and exit points during both uptrends and downtrends.
The main challenges include difficulty in identifying the pattern in real-time, dependence on the analyst's subjectivity, and the risk of false signals.
While the impulse wave pattern can provide insights into potential future price movements, it is not a guaranteed predictor. Its effectiveness relies heavily on accurate identification and interpretation.
The third wave in an impulse wave pattern is often the longest and most powerful, indicating strong market momentum in the direction of the prevailing trend.
True Tamplin is a published author, public speaker, CEO of UpDigital, and founder of Finance Strategists.
True is a Certified Educator in Personal Finance (CEPF®), author of The Handy Financial Ratios Guide, a member of the Society for Advancing Business Editing and Writing, contributes to his financial education site, Finance Strategists, and has spoken to various financial communities such as the CFA Institute, as well as university students like his Alma mater, Biola University, where he received a bachelor of science in business and data analytics.
To learn more about True, visit his personal website or view his author profiles on Amazon, Nasdaq and Forbes.


