
Financial indicators, also known as financial ratios, are numeric measurements derived from a company's financial statements. These indicators are used by investors, creditors, and company management to evaluate a firm's financial performance and health. The purpose of financial indicators is to make sense of the raw data provided in the income statement, balance sheet, and cash flow statement. Financial indicators play a crucial role in financial analysis by providing insights into a company's profitability, liquidity, efficiency, solvency, and market value. They help stakeholders assess the financial stability of a firm, evaluate operational efficiency, understand market perceptions, and make informed decisions. Profitability indicators measure a company's ability to generate profits relative to sales, assets, and equity. They provide insight into the company's pricing strategy, cost structure, and overall efficiency in utilizing resources. Common profitability indicators include Gross Profit Margin, Operating Profit Margin, Net Profit Margin, Return on Assets (ROA), and Return on Equity (ROE). Liquidity indicators assess a company's capacity to meet short-term obligations. A firm with high liquidity can quickly convert assets into cash without significant loss, reflecting its financial health. Liquidity indicators include the Current Ratio, Quick Ratio, and Cash Ratio. Efficiency indicators, also known as activity ratios, reflect how effectively a company utilizes its assets and manages its liabilities. These indicators include the Inventory Turnover Ratio, Receivables Turnover Ratio, Payables Turnover Ratio, and Asset Turnover Ratio. Solvency indicators measure a company's ability to meet long-term obligations, reflecting its long-term financial health and stability. These ratios include the Debt to Equity Ratio, Equity Ratio, and Debt Ratio. Market value indicators evaluate the performance and perceived value of a company's stock. These indicators, such as Earnings Per Share (EPS), Price to Earnings Ratio (P/E), Dividend Yield, and Market Book Ratio, are critical to investors and shareholders. The Gross Profit Margin is the ratio of gross profit to sales. It represents the percentage of revenue that exceeds the Cost of Goods Sold (COGS). A high gross profit margin indicates a company's effective control over its production costs. The Operating Profit Margin measures the proportion of revenue left after deducting operating expenses. It reflects the company's operational efficiency and its ability to control costs related to regular business operations. Net Profit Margin is the percentage of revenue remaining after all costs, expenses, taxes, and interest payments have been deducted. It is a key indicator of a company's overall profitability and financial health. ROA measures the profitability of a company relative to its total assets. It indicates how effectively a company uses its assets to generate profits. Return on Equity (ROE) indicates the profitability of a company by comparing net income to shareholder's equity. A high ROE signifies that a company is effectively generating profits for its shareholders. The Current Ratio measures a company's ability to pay off its short-term liabilities with its short-term assets. A ratio greater than one indicates that the company has more than enough assets to cover its immediate obligations. The Quick Ratio, or the acid-test ratio, evaluates a company's short-term liquidity excluding inventory, as it might not be easily converted to cash. A higher ratio indicates better short-term financial health. The Cash Ratio is the most conservative liquidity ratio. It compares a company's cash and cash equivalents to its current liabilities, showing the company's ability to pay off its current liabilities with only cash and cash equivalents. The Inventory Turnover Ratio shows how many times a company's inventory is sold and replaced over a specified period. A higher ratio indicates that the company manages its inventory efficiently, reducing storage, spoilage, and obsolescence costs. The Receivables Turnover Ratio measures how effectively a company extends credit and collects debts from its customers. A high ratio indicates effective credit and collection processes. The Payables Turnover Ratio reflects how quickly a company pays its suppliers. A lower ratio might suggest that the company takes longer to pay its suppliers, which could strain business relationships. The Asset Turnover Ratio measures how efficiently a company uses its assets to generate sales. A higher ratio indicates better asset utilization. The Debt to Equity Ratio measures a company's financial leverage by comparing its total liabilities to shareholders' equity. A higher ratio indicates that more of the company's operations are financed by debt. The Equity Ratio compares a company's total equity to its total assets, indicating the proportion of a company's assets financed by shareholders' equity. The Debt Ratio compares a company's total debt to its total assets. It reflects the proportion of a company's assets that are financed by debt. EPS is the portion of a company's profit allocated to each outstanding share of common stock. It serves as an indicator of a company's profitability. The P/E ratio compares a company's current share price to its per-share earnings. It shows how much investors are willing to pay per dollar of earnings. The Dividend Yield is a financial ratio that shows how much a company pays out in dividends each year relative to its stock price. The Market to Book Ratio compares a company's market value to its book value. A lower ratio might indicate that the stock is undervalued. Financial indicators play a crucial role in investment decisions by providing insights into a company's financial health, operational efficiency, and future growth prospects. Investors use these indicators to compare different investment options and choose the ones that align with their investment goals. Creditors and lenders use financial indicators to assess a company's ability to repay loans. These indicators help them understand the company's financial stability, cash flow status, and risk level. Company management uses financial indicators to make strategic decisions related to operations, capital expenditure, investment, financing, and dividend policy. These indicators provide insights into areas of strength and potential improvement. Financial indicators are based on historical data and might not accurately reflect a company's future performance. They should be used in conjunction with other forecasting methods for better decision-making. While financial indicators provide insights into a company's financial health and operational efficiency, they lack predictive power. They can't predict future market conditions or changes in consumer behavior that might impact the company's performance. Different accounting practices and policies can significantly impact financial indicators, potentially leading to misleading comparisons. Stakeholders should be aware of these practices when analyzing and interpreting these indicators. Financial indicators, defined as quantitative measures derived from a firm's financial statements, serve as powerful tools for analyzing a company's performance and financial health. The spectrum of financial indicators encompasses various dimensions, including profitability, liquidity, efficiency, solvency, and market value. Among these, profitability indicators such as Gross Profit Margin, Operating Profit Margin, Net Profit Margin, Return on Assets, and Return on Equity is especially crucial. They reveal the company's efficiency in generating profits relative to sales, assets, and equity, thereby offering profound insights into the company's financial operations. In summary, the comprehensive understanding and effective application of financial indicators is a pivotal aspect of financial analysis, guiding informed decision-making for investors, creditors, and company management alike.Definition of Indicators
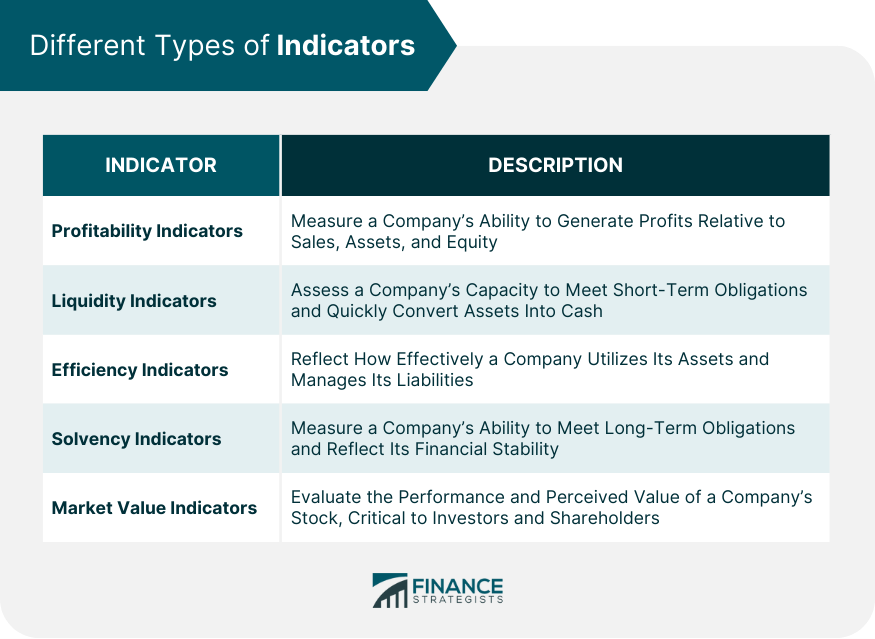
Different Types of Indicators
Profitability Indicators
Liquidity Indicators
Efficiency Indicators
Solvency Indicators
Market Value Indicators
Understanding the Profitability of Indicators
Gross Profit Margin
Operating Profit Margin
Net Profit Margin
Return on Assets (ROA)
Return on Equity (ROE)
Detailed Analysis of Liquidity Indicators
Current Ratio
Quick Ratio
Cash Ratio
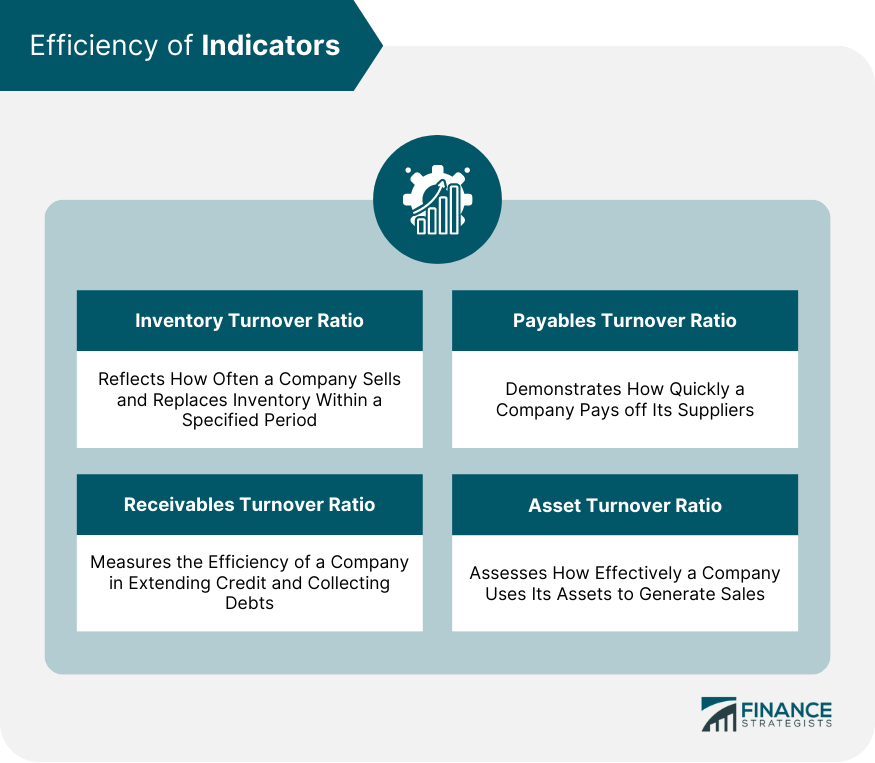
Efficiency of Indicators
Inventory Turnover Ratio
Receivables Turnover Ratio
Payables Turnover Ratio
Asset Turnover Ratio
Solvency of Indicators
Debt to Equity Ratio
Equity Ratio
Debt Ratio
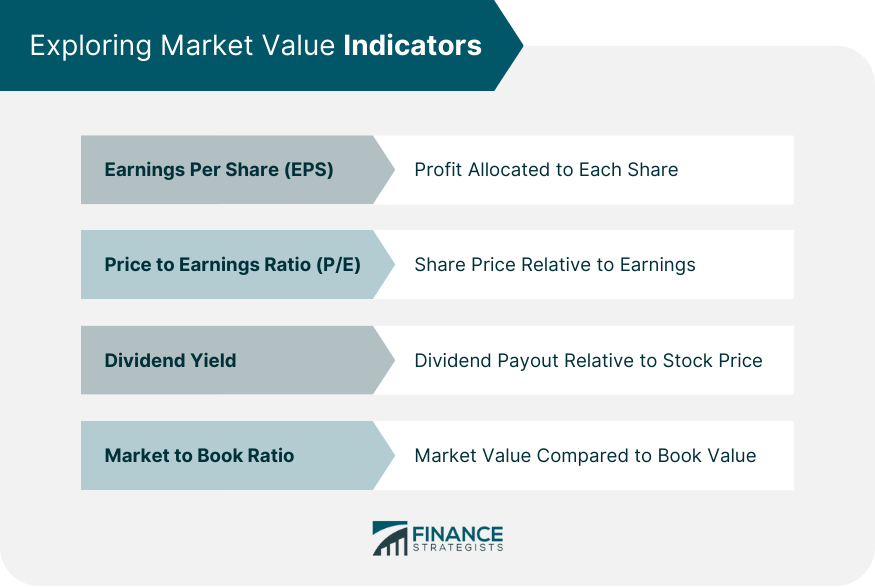
Exploring Market Value Indicators
Earnings Per Share (EPS)
Price to Earnings Ratio (P/E)
Dividend Yield
Market to Book Ratio
Applying Indicators in Business Decision-Making
Role in Investment Decisions
Role in Credit Decisions
Role in Internal Business Decisions
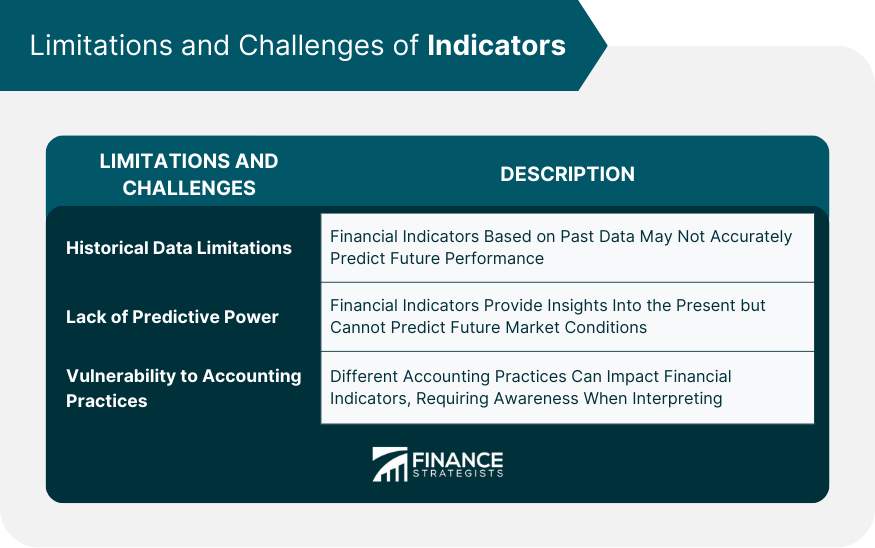
Limitations and Challenges of Indicators
Historical Data Limitations
Lack of Predictive Power
Vulnerability to Accounting Practices
Conclusion
Indicators FAQs
Financial indicators encompass various types: profitability indicators (e.g., Gross Profit Margin, Operating Profit Margin, Net Profit Margin, Return on Assets, Return on Equity), liquidity indicators (e.g., Current Ratio, Quick Ratio, Cash Ratio), efficiency indicators (e.g., Inventory Turnover Ratio, Receivables Turnover Ratio, Payables Turnover Ratio, Asset Turnover Ratio), solvency indicators (e.g., Debt to Equity Ratio, Equity Ratio, Debt Ratio), and market value indicators (e.g., Earnings Per Share, Price to Earnings Ratio, Dividend Yield, Market to Book Ratio).
Financial indicators provide insights into a company's financial health, operational efficiency, and future growth prospects. Investors use these indicators to compare different investment options and choose the ones that best align with their investment goals.
Financial indicators can assist management in making strategic decisions related to operations, capital expenditure, investment, financing, and dividend policy. They provide insights into areas of strength and potential improvement, guiding the decision-making process.
Financial indicators have certain limitations. They are based on historical data and might not accurately reflect a company's future performance. They also lack predictive power and can't predict future market conditions or changes in consumer behavior. Additionally, different accounting practices can significantly impact financial indicators, potentially leading to misleading comparisons.
Market value indicators such as Earnings Per Share (EPS), Price to Earnings Ratio (P/E), Dividend Yield, and Market Book Ratio are essential because they provide insights into the performance and perceived value of a company's stock. These indicators are critical for investors and shareholders when making investment decisions.
True Tamplin is a published author, public speaker, CEO of UpDigital, and founder of Finance Strategists.
True is a Certified Educator in Personal Finance (CEPF®), author of The Handy Financial Ratios Guide, a member of the Society for Advancing Business Editing and Writing, contributes to his financial education site, Finance Strategists, and has spoken to various financial communities such as the CFA Institute, as well as university students like his Alma mater, Biola University, where he received a bachelor of science in business and data analytics.
To learn more about True, visit his personal website or view his author profiles on Amazon, Nasdaq and Forbes.


