
The term 'Harami' is a Japanese word, translating to 'pregnant woman' in English. The term is a metaphorical representation of the pattern observed in the candlestick chart, where the first candle is 'pregnant' with the second smaller candle. This naming tradition aligns with other Japanese candlestick patterns that often take their names from metaphors. The Bullish Harami, a key concept in the financial analysis realm, is a candlestick chart pattern used to forecast potential price reversals from bearish to bullish. It provides traders with an early indication of a shift in market sentiment and potential bullish trading opportunities. In the arena of financial analysis, the Bullish Harami is deemed crucial due to its predictive capabilities. It offers analysts and traders a potential signal that a downtrend could be reaching its conclusion, marking a turning point towards an uptrend. The identification of a Bullish Harami offers traders a strategic advantage. By spotting this pattern early, traders can potentially position themselves to profit from the ensuing uptrend, reinforcing the pattern's significance in the financial analysis domain. The Bullish Harami is a two-candlestick pattern. The first candle, appearing at the end of a downtrend, is a large bearish candle. The second candle, which follows the bearish candle, is a smaller bullish candle, indicating buying pressure. The essence of the Bullish Harami lies in the positioning of the second candle. It must be 'encased' within the real body of the first candle, similar to a baby within its mother's belly. Hence, the reference to 'pregnant' in its name. In the Bullish Harami, the color representation of the candles is vital. The bearish candle, representing selling pressure, is typically shaded (traditionally black or red). Conversely, the bullish candle, representing buying pressure, is generally unshaded (traditionally white or green). The open and close prices of the two candles define the Bullish Harami. The first (bearish) candle opens at a higher price and closes lower, suggesting a dominant selling pressure. The second (bullish) candle opens at a lower price and closes higher, within the range of the preceding bearish candle. This reversal indicates the possible onset of an uptrend. The Bullish Harami pattern reflects a change in market sentiment. The large bearish candle signifies a market heavily skewed towards sellers, pushing the price downwards. However, the appearance of the smaller bullish candle hints at a change. It suggests that the bearish momentum may be waning as buyers begin to enter the market. The second candle in the Bullish Harami signifies the transition in momentum. As the second candle forms within the range of the first, it shows a decreased intensity in selling and an increased willingness of buyers to enter the market. This shift can mark the beginning of a bullish trend, with buyers outpacing sellers and pushing prices higher. The volume of trading during the formation of a Bullish Harami can add credence to the pattern. A high trading volume during the formation of the bearish candle, followed by a decreased volume during the formation of the bullish candle, can reinforce the Harami pattern. This shift indicates that sellers are losing control and buyers are preparing to take over. Confirmation from other bullish indicators can strengthen the reliability of a Bullish Harami. Traders often look for confirmation using indicators like moving averages, relative strength index (RSI), or stochastic oscillators. For instance, a Bullish Harami occurring near a long-term moving average could be a stronger signal of a potential reversal. A Bullish Harami's strength and significance increase when it appears after a prolonged price decline or at a long-term support level. If the pattern appears at a seemingly random place in the chart, its predictive power might not be as strong. Hence, the context within the broader price trend is essential when interpreting a Bullish Harami. Recognizing a Bullish Harami on a stock chart can be a vital skill for traders and investors alike. This pattern can indicate potential trend reversals, providing valuable clues about the market sentiment. Here's a detailed, step-by-step guide on how to spot a Bullish Harami: The first step in identifying a Bullish Harami is to find a prevailing downtrend. A downtrend is characterized by lower highs and lower lows in the price of the stock, signifying a bearish market. It is essential to note that a Bullish Harami is a trend-reversal pattern and can only occur after a significant period of downtrend. After identifying the downtrend, the next step is to spot a large bearish candle marking the end of this downtrend. A bearish candle, often shaded or colored (usually red or black in most charts), indicates that the closing price was lower than the opening price for that particular time frame. Following the large bearish candle, watch for a smaller bullish candle that forms. A bullish candle, often unshaded or differently colored (commonly green or white), indicates that the closing price was higher than the opening price for that time frame. The key point here is that the open and close prices of the bullish candle should be contained within the range of the preceding bearish candle's body. This forms the 'Harami', which means 'pregnant' in Japanese, symbolizing the smaller candle 'inside' the larger one. While the Bullish Harami is a potentially powerful pattern, there are several pitfalls and common mistakes that traders need to be aware of: One of the most common mistakes made by traders is misinterpreting the Bullish Harami. Remember, a Bullish Harami isn't a guarantee of a bullish reversal, but rather a signal of potential change. It should be used as a part of an analysis strategy and always requires confirmation from other technical indicators or patterns before making any trading decisions. Volume plays a crucial role in the strength of the Bullish Harami pattern. Ideally, there should be high volume during the formation of the bearish candle and lower volume during the bullish candle formation. This signals a decrease in selling pressure and potentially the beginning of buying interest, strengthening the validity of the pattern. The Bullish Harami's effectiveness is not solely based on its formation. The context in which it appears also matters significantly. The pattern's effectiveness is magnified when it appears after a sustained downtrend or at a long-term support level. Without considering the overall market context, traders might get trapped into false signals. Upon the identification and confirmation of a Bullish Harami, traders can consider this as a potential entry point for a long position. Set stop-loss orders below the low of the Bullish Harami pattern. This strategy limits potential losses if the pattern fails and the price continues to decline. Profit targets could be set at resistance levels or based on particular risk-reward ratios. The specific strategy varies based on the trader's approach and market conditions. The bullish harami pattern can serve as an early warning sign of a potential trend reversal in the market. It occurs when a small bearish candle is followed by a larger bullish candle, indicating that the selling pressure may be diminishing and buyers are starting to enter the market. By recognizing the bullish harami pattern, traders can position themselves to take advantage of potential uptrends in the market. This pattern suggests that the bearish momentum is waning, and it may be an opportune time to enter long positions or increase exposure to the market. The bullish harami can be used in conjunction with other technical analysis tools and indicators to enhance trading decisions. Traders often combine it with trend lines, moving averages, or other patterns to confirm the potential bullish reversal and increase the probability of a successful trade. Like any other technical pattern, the bullish harami is not foolproof and can sometimes result in false signals. It's essential to consider other factors and confirmatory signals before making trading decisions solely based on this pattern. To increase the reliability of the bullish harami pattern, traders often seek confirmation from other technical indicators or patterns. Relying solely on the bullish harami without considering other signals may lead to inaccurate predictions and potential losses. The bullish harami's effectiveness can be influenced by the prevailing market conditions and the context in which it appears. For example, if the pattern occurs in a strong downtrend, its bullish signal may be less reliable compared to when it appears after a prolonged consolidation or a significant support level. The Bullish Harami shares similarities with other two-candlestick patterns, such as the Bullish Engulfing pattern. Both patterns signal potential bullish reversals, but their structure differs. In the Bullish Engulfing pattern, the bullish candle 'engulfs' the preceding bearish candle, whereas in the Bullish Harami, the bullish candle forms within the range of the bearish candle's body. Some other bullish reversal patterns include the Hammer, the Bullish Engulfing, and the Piercing Line patterns. These patterns also suggest a potential shift from a bearish to a bullish trend. The Bullish Harami is a two-candlestick pattern that plays a crucial role in financial analysis. Its characteristic structure, with a small bullish candle enclosed within a larger bearish candle, hints at a potential reversal in market sentiment from bearish to bullish. Several factors come into play in assessing the strength and reliability of a Bullish Harami. These include trading volume during the formation of the pattern, confirmation from other bullish indicators, and the pattern's context within the larger price trend. While the Bullish Harami offers numerous advantages, such as early indications of potential bullish reversals and strategic positioning for uptrends, it also carries certain risks. It is not always a guaranteed signal of a bullish reversal, as false signals can occur. Hence, confirmation from other indicators or patterns is vital for enhancing its reliability. The complexities associated with identifying, interpreting, and trading based on the Bullish Harami underscore the value of expert guidance. If you're keen on leveraging the power of Bullish Harami and other technical analysis tools for trading, it is recommended to seek professional wealth management services. What Is a Bullish Harami?
Origin and Significance
Importance in Financial Analysis
Basic Structure of a Bullish Harami
Two-Candlestick Pattern
Color Representation of the Candles
Open and Close Prices
Psychology Behind the Bullish Harami
Market Sentiment in a Bullish Harami Pattern
Transition From Bearish to Bullish Momentum
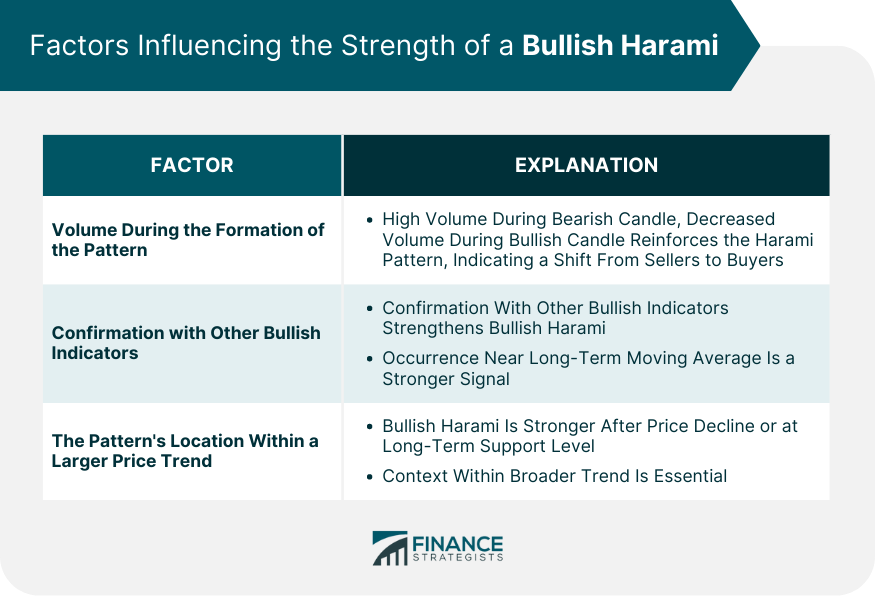
Factors Influencing the Strength of a Bullish Harami
Volume During the Formation of the Pattern
Confirmation With Other Bullish Indicators
Pattern's Location Within a Larger Price Trend
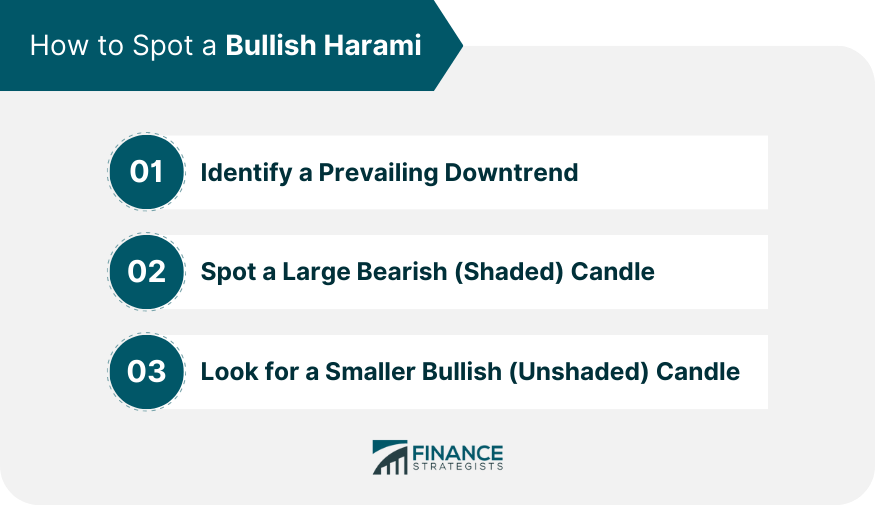
Step-By-Step Guide to Spotting a Bullish Harami
Step 1: Identify a Prevailing Downtrend
Step 2: Spot a Large Bearish (Shaded) Candle
Step 3: Look for a Smaller Bullish (Unshaded) Candle
Potential Pitfalls and Common Mistakes When Trading Bullish Harami
Misinterpreting the Pattern
Ignoring Volume
Context is Key
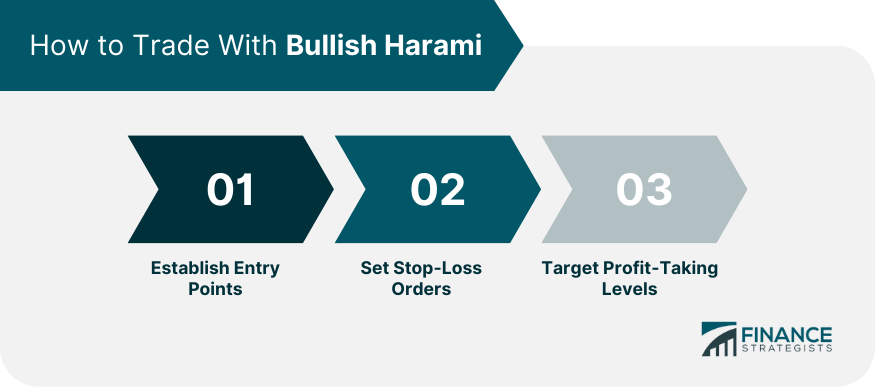
How to Trade With Bullish Harami
Establish Entry Points
Set Stop-Loss Orders
Target Profit-Taking Levels
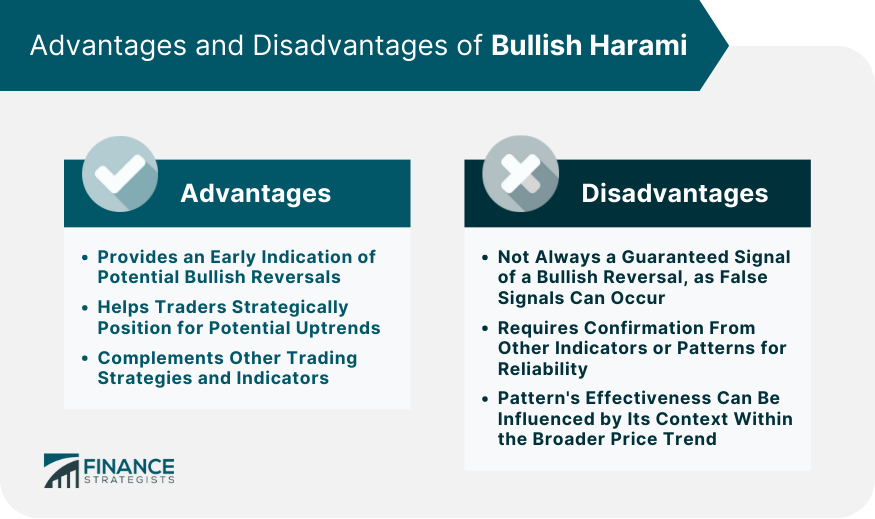
Advantages of Bullish Harami
Provides an Early Indication of Potential Bullish Reversals
Helps Traders Strategically Position for Potential Uptrends
Complements Other Trading Strategies and Indicators
Disadvantages of Bullish Harami
Not Always a Guaranteed Signal of a Bullish Reversal
Requires Confirmation From Other Indicators or Patterns for Reliability
Pattern’s Effectiveness Can Be Influenced by Its Context Within the Broader Price Trend
Comparing Bullish Harami to Other Candlestick Patterns
Similarities and Differences With Other Patterns
Examples of Other Bullish Reversal Patterns
Final Thoughts
Bullish Harami FAQs
A Bullish Harami is a candlestick pattern used in technical analysis to predict a potential reversal from a bearish trend to a bullish trend.
A Bullish Harami is identified by a two-candlestick pattern: a large bearish candle followed by a smaller bullish candle, with the bullish candle's open and close prices within the range of the bearish candle's body.
A Bullish Harami indicates a potential shift in market sentiment, signaling the possibility of a bullish trend following a bearish trend.
While Bullish Harami patterns can be powerful indicators of a potential trend reversal, they are not 100% reliable and should be used in conjunction with other technical analysis tools.
Upon identification and confirmation of a Bullish Harami, traders can use it as a potential entry point for a long position, setting stop-loss orders below the pattern's low, and targeting profit-taking levels based on resistance levels or specific risk-reward ratios.
True Tamplin is a published author, public speaker, CEO of UpDigital, and founder of Finance Strategists.
True is a Certified Educator in Personal Finance (CEPF®), author of The Handy Financial Ratios Guide, a member of the Society for Advancing Business Editing and Writing, contributes to his financial education site, Finance Strategists, and has spoken to various financial communities such as the CFA Institute, as well as university students like his Alma mater, Biola University, where he received a bachelor of science in business and data analytics.
To learn more about True, visit his personal website or view his author profiles on Amazon, Nasdaq and Forbes.


