
The Upside/Downside Ratio is a market breadth indicator used in technical analysis to measure the momentum of stocks moving upwards versus downwards. It is calculated by dividing the volume of advancing stocks by the volume of declining stocks. The purpose of this ratio is to assess the overall health and sentiment of the market. A ratio greater than one signifies bullish market conditions with more stocks advancing, while a ratio less than one indicates bearish conditions with more stocks declining. Hence, it provides critical insights into market trends and potential reversals, aiding in informed investment decisions. Understanding the Upside/Downside Ratio is impactful for investors and traders as it assists in determining the strength of a market trend and identifying potential entry and exit points. Within the broader context of market analysis, this ratio is a vital component of a comprehensive toolkit to interpret and navigate market dynamics effectively. Calculating the upside/downside ratio can be straightforward with the right components in hand. The upside/downside ratio formula is as follows: The average return of up periods is the mean of the returns during the periods when the price of an asset increases. Conversely, the average return of down periods is the mean of the returns during periods when the asset's price decreases. Suppose an asset had five up periods with returns of 5%, 7%, 9%, 3%, and 8%, and four down periods with returns of -2%, -4%, -3%, and -5%. The average return of up periods would be 6.4%, while the average return of down periods would be -3.5%. Thus, the upside/downside ratio would be -1.83, indicating more downside risk than upside potential. Understanding the implications of the ratio's value is vital for informed investment decisions. High Upside/Downside Ratio: A high upside/downside ratio indicates a higher potential for gain relative to potential loss. Such an investment might be attractive to risk-seeking investors. Low Upside/Downside Ratio: A low ratio indicates higher potential loss relative to potential gain. This information might discourage risk-averse investors from investing in the asset. Neutral Interpretation of the Ratio: A ratio of 1 indicates that the potential for gain is equal to the potential for loss. This balance might be attractive to risk-neutral investors. A ratio is a crucial tool in portfolio management, risk analysis, and investment decision-making. Investors can use the ratio to balance their portfolios between high-risk and low-risk assets. A diversified portfolio often contains a mix of assets with varying upside/downside ratios. The ratio provides a quantitative measure of an. It can help investors identify whether an investment's potential return is worth the associated risk. A high ratio might prompt a buy decision, a low ratio might lead to a sell decision, and a neutral ratio might result in a hold decision. However, these actions depend on the investor's risk tolerance and investment strategy. It's helpful to compare the upside/downside ratio with other financial ratios to understand its unique value. The Sharpe ratio is another risk-adjusted performance measure. It considers both the expected return and the standard deviation of returns. Unlike the upside/downside ratio, the Sharpe ratio does not differentiate between up and down periods. The Sortino ratio adjusts for downside risk only, unlike the upside/downside ratio, which considers both upside and downside risk. The Sterling ratio uses the average of the three worst drawdowns in its calculation. In contrast, the upside/downside ratio uses the average return of all up and down periods. Despite its usefulness, the ratio has some limitations that investors must consider. Investors should be aware that the ratio does not account for the frequency of up and down periods. Also, a high ratio does not necessarily mean a good investment if the asset's price is subject to extreme volatility. The ratio might overstate the potential gain or understate the potential loss if the asset's price exhibits skewed returns. That is if the asset has a few periods of extreme returns that significantly affect the average. Some critics argue that the ratio is too simplistic, failing to consider other important factors such as an asset's volatility, liquidity, and the broader market context. The Upside/Downside Ratio is a crucial market breadth indicator, providing valuable insights into market health, trend strength, and potential reversals. By calculating the volume of advancing stocks against declining ones, investors can assess market sentiment and make informed decisions. Understanding this ratio is essential, as it helps gauge the balance between risk and reward, informing buy, sell, or hold decisions. Although useful, it is important to recognize the limitations, such as potential misinterpretation due to neglecting the frequency of up and down periods or the potential misrepresentation of investment risk. Technological advancements and evolving investor attitudes might shape the future use of this ratio, potentially increasing its reliability and status. Amid growing market uncertainty, the Upside/Downside Ratio is poised to become an increasingly significant tool for navigating the ever-evolving financial landscape.Upside/Downside Ratio Overview
Calculation of Upside/Downside Ratio
Mathematical Formula for Upside/Downside Ratio
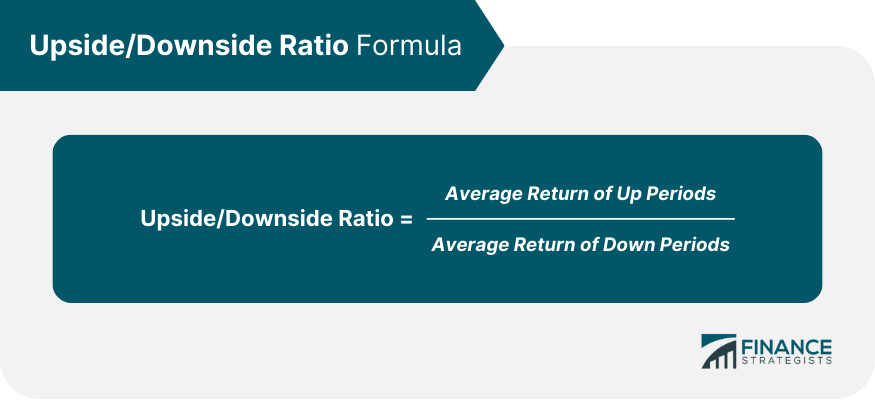
Explanation of Each Component in the Formula
Example of Upside/Downside Ratio Calculation
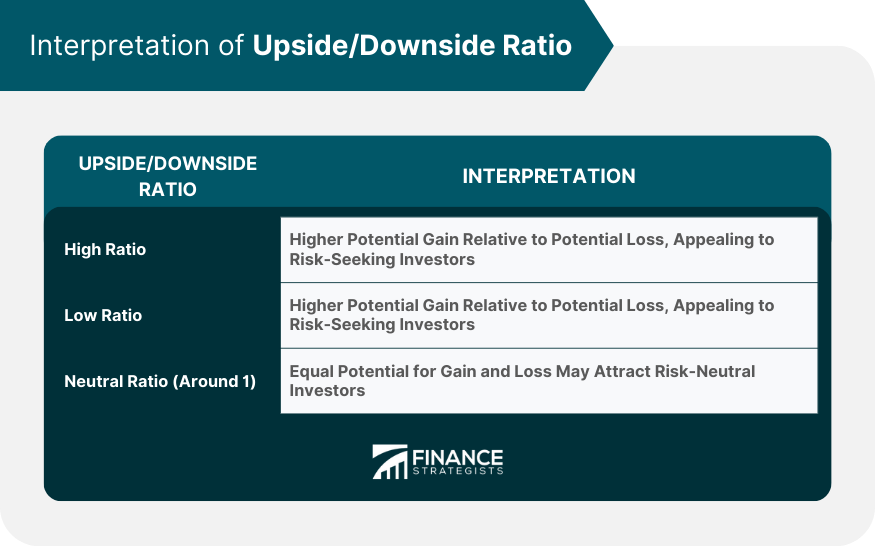
Interpretation of Upside/Downside Ratio
Upside/Downside Ratio in Investment Decision-Making
Role of Upside/Downside Ratio in Portfolio Management
Using the Ratio for Risk Analysis
Implications of the Ratio for Buy, Sell, or Hold Decisions
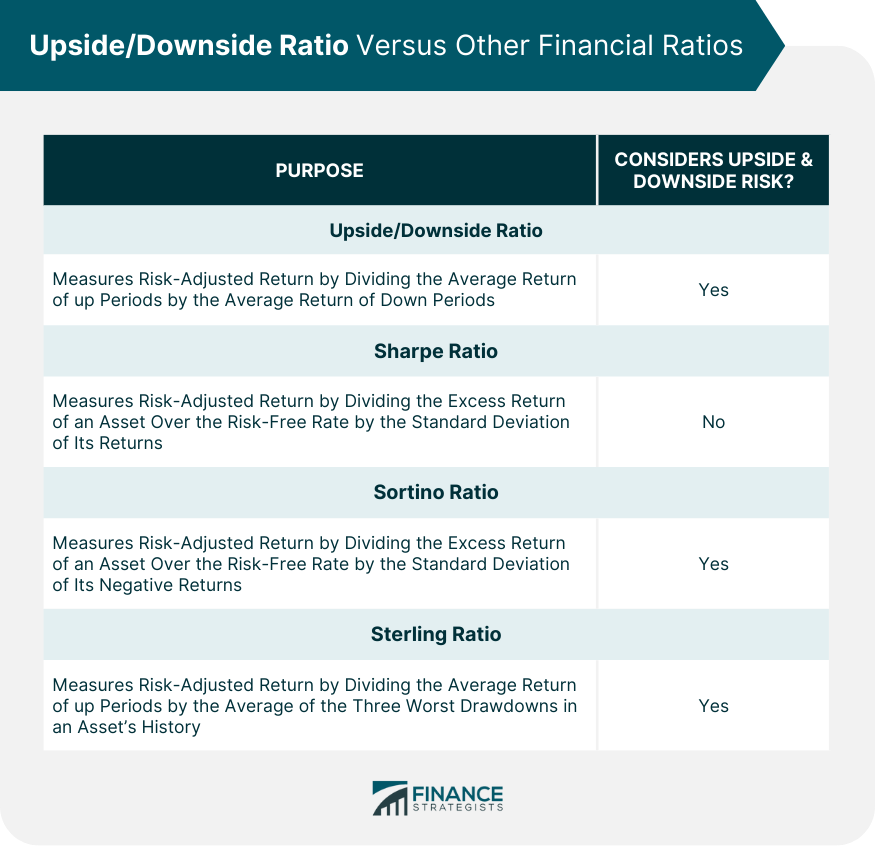
Upside/Downside Ratio Versus Other Financial Ratios
Comparison With the Sharpe Ratio
Comparison With the Sortino Ratio
Comparison With the Sterling Ratio
Limitations of the Upside/Downside Ratio
Potential Misinterpretations and Pitfalls
How the Ratio Can Misrepresent Investment Risk
Critiques of the Upside/Downside Ratio
Final Thoughts
Upside/Downside Ratio FAQs
The upside/downside ratio is a financial metric used to compare the potential for gain (upside) against the potential for loss (downside) in an investment. It's important because it helps investors understand the risk-reward tradeoff of an investment. This can guide them in making informed investment decisions that align with their risk tolerance.
The upside/downside ratio is calculated by dividing the average return of up periods (periods when the price of an asset increases) by the average return of down periods (periods when the price of an asset decreases). By comparing these average returns, the ratio provides a measure of the potential gain relative to the potential loss.
A high upside/downside ratio indicates that there is a higher potential for gain relative to loss. This may be attractive to risk-seeking investors. Conversely, a low upside/downside ratio shows that there is a higher potential for loss relative to gain, which may discourage risk-averse investors.
The upside/downside ratio differentiates itself from other financial ratios by focusing on the potential gains and losses of an investment. Unlike the Sharpe ratio, it differentiates between up and down periods. It is also different from the Sortino ratio, which only considers downside risk, and the Sterling ratio, which focuses on the worst drawdowns.
While the upside/downside ratio is a useful tool, it doesn't account for the frequency of up and down periods or other important factors like an asset's volatility, liquidity, or broader market context. It could also misrepresent investment risk if an asset's price exhibits skewed returns. Thus, while it is a useful metric, it should be used in conjunction with other measures of risk and return.
True Tamplin is a published author, public speaker, CEO of UpDigital, and founder of Finance Strategists.
True is a Certified Educator in Personal Finance (CEPF®), author of The Handy Financial Ratios Guide, a member of the Society for Advancing Business Editing and Writing, contributes to his financial education site, Finance Strategists, and has spoken to various financial communities such as the CFA Institute, as well as university students like his Alma mater, Biola University, where he received a bachelor of science in business and data analytics.
To learn more about True, visit his personal website or view his author profiles on Amazon, Nasdaq and Forbes.


