
A horizontal channel in trading is a period when the price of a financial asset, such as stocks, commodities, or currencies, moves within a certain range without clear upward or downward momentum. This happens when buying and selling pressures are nearly balanced, resulting in a sideways price movement. The channel is demarcated by two horizontal lines on the price chart: the resistance and support levels, signifying upper and lower limits that the price typically does not cross, respectively. Traders leverage these levels to predict future price actions, selling when the price rebounds from the resistance level and buying when it bounces from the support level. However, a breakout, which occurs when the price crosses either the resistance or support line, signifies a potentially strong upward or downward trend, prompting traders to modify their strategies. Horizontal channels are characterized by two parallel trend lines that track the price movement of an asset over time. The alignment of these lines forms a 'channel' within which the asset's price oscillates. The formation of these parallel lines, and thus the channel, is contingent on a series of peaks and troughs that reach similar levels. The upper trendline of a horizontal channel is referred to as the resistance line. This line is drawn by connecting the peaks or high points of the asset's price over a specific period. The resistance line signifies the level where selling pressure outweighs buying pressure, making it difficult for the price to rise above this line. When the price reaches the resistance line, it often rebounds downwards due to this selling pressure. The lower trendline of a horizontal channel is known as the support line. This line is plotted by connecting the troughs or low points of the asset's price over a set period. The support line represents the level where buying pressure exceeds selling pressure, making it challenging for the price to fall below this line. When the price approaches the support line, it frequently rebounds upwards due to the increased buying pressure. Within the horizontal channel, the asset's price tends to oscillate between the resistance and support lines. This back-and-forth price movement results from the continuous shifting balance between buying and selling pressures. This is why horizontal channels are often associated with a sideways or range-bound market, where no clear upward (bullish) or downward (bearish) trend is evident. While the price of an asset tends to stay within the horizontal channel, there can be instances where it 'breaks out' of this channel. A breakout, either above the resistance line or below the support line, is a significant event and often signals a potential change in the market trend. Breakouts need to be confirmed by high volume to be valid; otherwise, they could be false breakouts or "whipsaws." Horizontal channels can serve as an effective tool in devising trading strategies. Traders often buy at the support line (assuming that the price will rebound upwards) and sell at the resistance line (assuming the price will bounce downwards). However, in case of a breakout, traders may decide to enter a trade in the direction of the breakout, expecting the start of a new trend. One of the primary strategies employed by traders when dealing with horizontal channels is buying near the support line. This line, as the lower boundary of the channel, represents a zone where prices have historically rebounded. Due to the increased buying pressure at these levels, it becomes an ideal point for traders to initiate a long position, banking on the price's proclivity to bounce back up. On the flip side, the upper boundary, the resistance line, indicates a price level at which the asset has had trouble moving past. This trouble arises from an increase in selling pressure. Therefore, it is common strategy for traders to sell or short sell at this point, anticipating a potential price drop as the asset struggles to break the resistance. Within the confines of a horizontal channel, range trading becomes a feasible and popular strategy. The premise of range trading is simple: buy at the lower boundary (support line) and sell at the upper boundary (resistance line). By doing so, traders are effectively capitalizing on the predictable oscillations of the price within the channel. Traders can also leverage other technical indicators when trading within a horizontal channel. These might include momentum oscillators, volume indicators, or moving averages. Using these indicators in conjunction with horizontal channels can provide additional confirmation signals, thus boosting the confidence of a trader before entering or exiting a trade. One of the key risks to be aware of when trading within a horizontal channel is the potential for unexpected price breakouts. This scenario is when the price suddenly moves beyond the support or resistance lines, potentially leading to significant losses. In light of the risk of breakouts, the use of stop-loss orders becomes critical. These orders allow traders to limit potential losses by automatically closing a position if the price moves against their expectations. Lastly, it is crucial for traders to be cognizant of the market conditions when utilizing horizontal channels. These channels tend to be most effective in stable markets and can become less reliable during periods of high volatility or major news events. There are several tools and technical indicators traders can utilize to identify horizontal channels. Charting software, including trading platforms like MetaTrader, TradingView, or ThinkorSwim, can help traders visually plot support and resistance lines to form the channel. Other indicators, such as the Relative Strength Index (RSI), Bollinger Bands, or Moving Average Convergence Divergence (MACD), can provide additional confirmation of the channel. Unlike ascending or descending channels where prices trend upward or downward, respectively, prices in a horizontal channel move sideways, oscillating between a set support and resistance line. Thus, horizontal channels indicate a consolidation period where buying and selling pressures equalize. Horizontal channels are often indicative of a market indecision period. The alternating buying and selling pressures reflect an equilibrium between bullish and bearish market sentiment. This can help traders identify potential trend reversals or continuations after the price breaks out of the channel. Within the confines of a horizontal channel, price volatility is generally lower as the price oscillates between the set support and resistance levels. However, a breakout or breakdown from the channel can lead to increased volatility as the price moves to establish a new trend. The horizontal channel, characterized by an asset's price fluctuating between the support and resistance lines, is a key tool in the trader's arsenal. This pattern, indicative of market consolidation, provides clear buy and sell signals, as traders typically purchase at the support line and sell at the resistance line. However, trading is fraught with risk, as unexpected breakouts from the channel can lead to significant losses. Hence, traders should reinforce their strategies with stop-loss orders and other technical indicators. Although understanding and utilizing horizontal channels can enhance a trader's toolkit, there are no guaranteed profits in trading due to its inherent risks. It's advisable to seek professional advice or engage wealth management services for informed decision-making and achieving financial objectives in this complex financial landscape.What Is a Horizontal Channel?
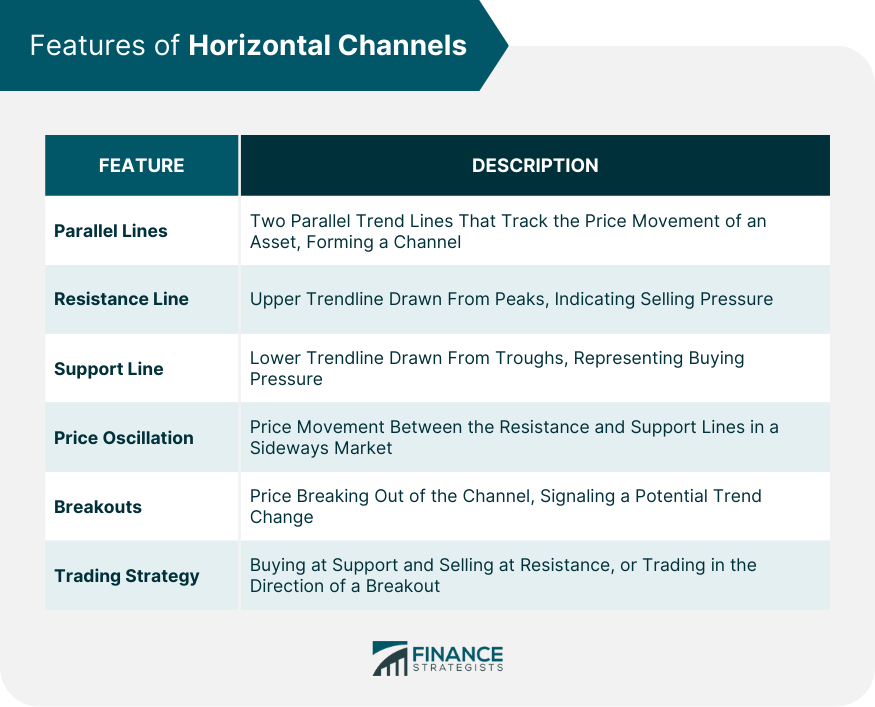
Features of Horizontal Channels
Parallel Lines
Resistance Line
Support Line
Price Oscillation
Breakouts
Trading Strategy
Proficient Use of Horizontal Channels
Buying Near Support Line
Selling Near Resistance Line
Trading Strategies in the Horizontal Channel
Embracing Range Trading
Harnessing the Power of Technical Indicators
Navigating Risks in Horizontal Channel Trading
Beware of Unexpected Breakouts
Importance of Stop-Loss Orders
Assessing Market Conditions
Identifying Horizontal Channels
Tools and Indicators for Spotting Horizontal Channels
Difference Between Horizontal and Other Types of Channels
Impact of Horizontal Channels on Market Behavior
How Horizontal Channels Reflect Market Sentiment
Influence of Horizontal Channels on Price Volatility
Final Thoughts
Horizontal Channel FAQs
A horizontal channel in trading is a price pattern characterized by two parallel trendlines connecting variable pivot highs and lows, indicating a sideways price movement.
Traders often use horizontal channels to identify potential entry and exit points for trades. Typically, traders buy near the support line and sell near the resistance line within the channel.
The main risk associated with trading within horizontal channels is the potential for unexpected price breakouts or breakdowns from the channel, which can result in significant losses.
Unlike ascending or descending channels that show a clear uptrend or downtrend, a horizontal channel indicates a sideways price movement, suggesting market indecision.
Charting software and technical indicators, such as the Relative Strength Index (RSI), Bollinger Bands, or Moving Average Convergence Divergence (MACD), can help identify horizontal channels.
True Tamplin is a published author, public speaker, CEO of UpDigital, and founder of Finance Strategists.
True is a Certified Educator in Personal Finance (CEPF®), author of The Handy Financial Ratios Guide, a member of the Society for Advancing Business Editing and Writing, contributes to his financial education site, Finance Strategists, and has spoken to various financial communities such as the CFA Institute, as well as university students like his Alma mater, Biola University, where he received a bachelor of science in business and data analytics.
To learn more about True, visit his personal website or view his author profiles on Amazon, Nasdaq and Forbes.


