
Market indicators, also known as market benchmarks, serve as crucial statistical tools utilized by economists, investors, and policymakers for comprehending current and future investment prospects. Comparable to compasses navigating the complex financial landscape, these indicators range from macroeconomic data points to sector-specific indices. Their aim is to illuminate economic trends and market movements, thereby enabling stakeholders to make informed decisions. Integral to the financial market's ecosystem, market indicators aid in discerning market trends, assessing risks and opportunities, and guiding the formulation of economic growth strategies. They empower investors to decide on the optimal times for buying or selling securities. Offering a snapshot of the economy's health, market indicators influence a broad spectrum of elements, from interest rates to government policies. Hence, the understanding of these indicators is paramount for those involved in financial planning, investing, or economic policy development. Leading indicators is those that change before the economy as a whole change. They're used to predict future movements in the economy and financial markets. For example, stock market returns are often considered a leading indicator as the stock market tends to decline before the economy declines and improves before the economy recovers. On the other end of the spectrum, lagging indicators are those that follow an economic event. They are useful for confirming a pattern that is occurring. For instance, the unemployment rate tends to rise after a downturn in the economy. Coincident indicators change roughly concurrently with the overall economy. They provide information about the current state of the economy. An example of a coincident indicator would be Gross Domestic Product, which illustrates the country's economic performance. Economic indicators are typically the most widely watched market indicators, providing the most comprehensive view of the overall economy. They include Gross Domestic Product, Unemployment, Inflation, and Interest Rates. Gross Domestic Product (GDP): GDP measures all goods and services produced by a country within a specific period. It's widely used to gauge the health of an economy. The faster GDP grows, the better the economy is considered to be. Unemployment Rate: This is the percentage of the total labor force that is jobless and actively seeking employment. Changes in the unemployment rate can significantly affect the stock market. Inflation Rate: Inflation is the rate at which the general level of prices for goods and services is rising. It's important as it affects purchasing power, a key economic activity driver. Interest Rates: Interest rates, set by a country's central bank, are a key economic indicator as they can influence borrowing costs, investment appetite, and inflation. Technical indicators are mathematical calculations based on the price, volume, or open interest of a security or contract used by traders who follow technical analysis. These indicators include Moving Averages, Relative Strength Index, Moving Average Convergence Divergence, and Bollinger Bands. Moving Averages: This indicator helps traders identify trends by smoothing out price fluctuations. It's often used in tandem with other indicators to confirm significant market moves and gauge their validity. Relative Strength Index (RSI): RSI is a momentum oscillator that measures the speed and change of price movements on a scale of 0 to 100. Traders use it to identify overbought or oversold conditions in a market. Moving Average Convergence Divergence (MACD): The MACD is a trend-following momentum indicator that shows the relationship between two moving averages of a security’s price. It is used to identify potential buy and sell signals. Bollinger Bands: These are volatility bands placed above and below a moving average where volatility is based on the standard deviation, which changes as volatility increases or decreases. Sentiment indicators are used to gauge how certain groups are feeling about the current economic environment. They include the Put/Call Ratio, Volatility Index, and Bull/Bear Ratio. Put/Call Ratio: This ratio is used by investors to gauge market sentiment. A high Put/Call Ratio suggests that the investors expect the market to decline. Volatility Index (VIX): Often referred to as the "fear index," the VIX measures expected price fluctuations in the S&P 500 Index options over the next 30 days. Bull/Bear Ratio: This ratio is based on a weekly poll of investment advisors as to their views about the market's future direction. A high ratio suggests bullish sentiment. Market indicators are crucial in various aspects of investment decision-making, including fundamental analysis, technical analysis, risk management, and portfolio diversification. In fundamental analysis, market indicators provide valuable insights into an economy's overall health and individual companies' performance. They help investors evaluate a company's intrinsic value and long-term growth potential. Technical analysts or chartists use market indicators to predict future price movements based on past market performance. They focus more on charts and other trading patterns to forecast future price trends. Risk management involves identifying, assessing, and prioritizing uncertainties potentially impacting investment returns. Market indicators can offer insights into possible economic and market downturns, helping investors manage their risk exposure. Market indicators can provide useful information for diversifying an investment portfolio. By understanding various market and economic trends, investors can spread their assets across different investments to reduce risk and maximize returns. Despite their usefulness, market indicators have limitations, and their use comes with certain risks. Investors need to consider these limitations while making investment decisions. The Efficient Market Hypothesis (EMH) states that markets are perfectly efficient, and all available information is already reflected in the price of securities. If EMH holds true, then any analysis based on market indicators would be redundant. However, most believe markets could be more perfectly efficient, and market indicators can provide valuable insights. Many economic indicators have a time lag, meaning they reflect past data. Changes may have already occurred in the economy by the time data is reported, which can lead to inaccurate conclusions. While individual market indicators can provide valuable information, relying on a single indicator can be risky. Analyzing multiple indicators for a more comprehensive market view is usually better. Market indicators can be complex, and misinterpretations can lead to poor investment decisions. It's crucial to understand what each indicator measures and the context in which it should be used. Market indicators play a crucial role in investment decision-making. They provide valuable insights into economic trends, market movements, and sentiment, empowering investors, economists, and policymakers to make informed choices. By analyzing leading, lagging, and coincident indicators, stakeholders can predict future movements, confirm patterns, and gauge the current state of the economy. Economic indicators such as GDP, unemployment rate, inflation rate, and interest rates offer a comprehensive view of the overall economy. Technical indicators like moving averages, RSI, MACD, and Bollinger Bands aid in identifying trends and potential buy/sell signals. Sentiment indicators like Put/Call Ratio, VIX, and Bull/Bear Ratio reflect market sentiment. However, it's important to acknowledge the limitations and risks associated with market indicators, including the efficiency paradox, time lag, over-reliance on a single indicator, and potential misinterpretation. Despite these challenges, a careful and comprehensive analysis of market indicators can significantly enhance investment decision-making processes.What Are Market Indicators?
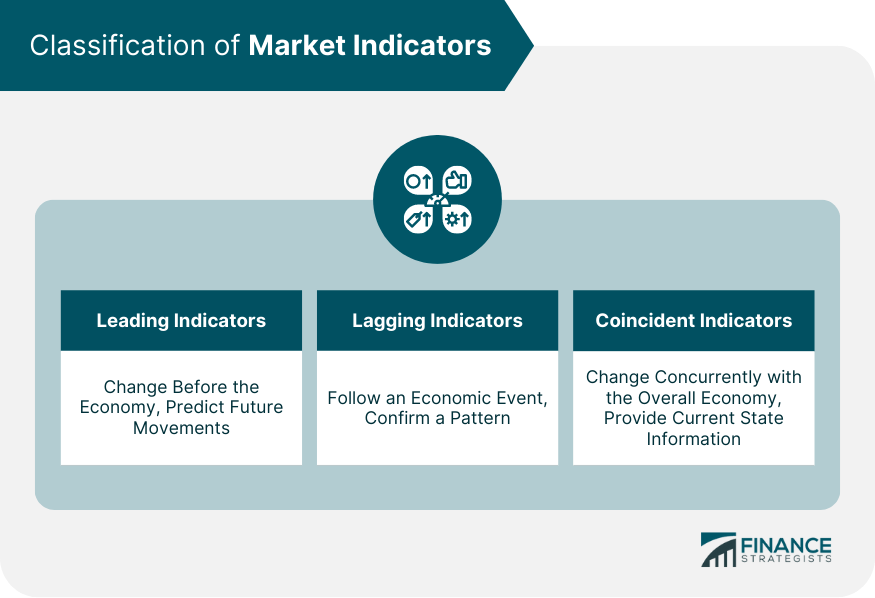
Classification of Market Indicators
Leading Indicators
Lagging Indicators
Coincident Indicators
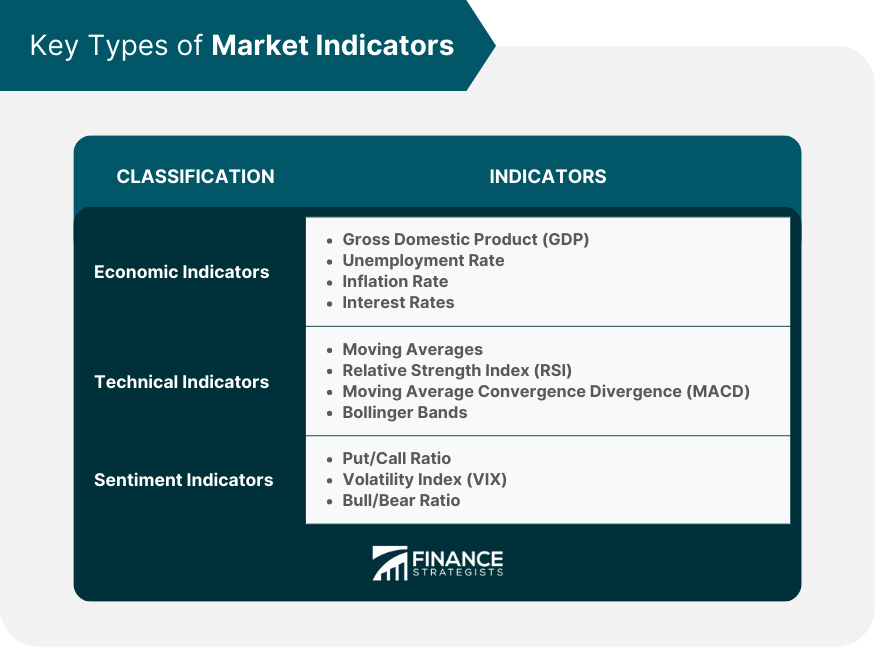
Key Types of Market Indicators
Economic Indicators
Technical Indicators
Sentiment Indicators
Usage of Market Indicators in Investment Decision Making
Fundamental Analysis
Technical Analysis
Risk Management
Portfolio Diversification
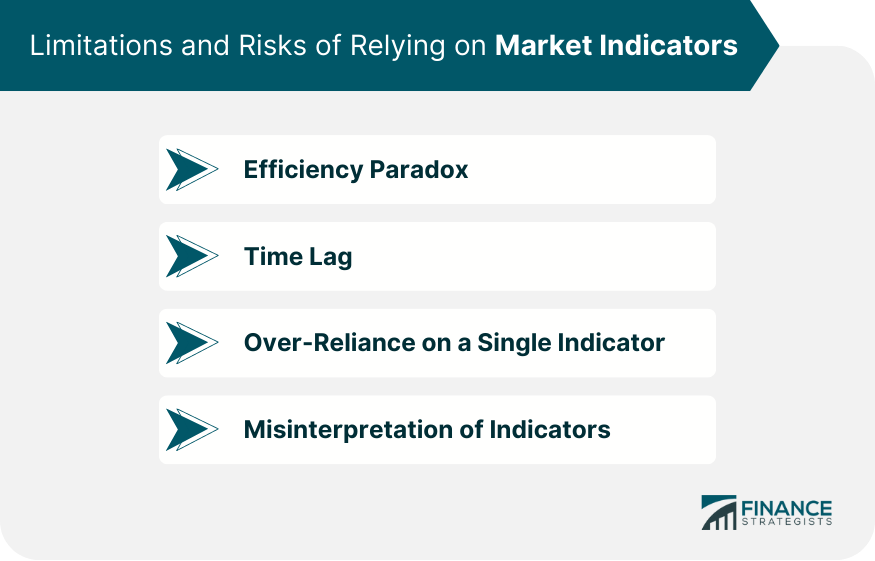
Limitations and Risks of Relying on Market Indicators
Efficiency Paradox
Time Lag
Over-Reliance on a Single Indicator
Misinterpretation of Indicators
Final Thoughts
Market Indicators FAQs
Common market indicators include economic indicators like GDP, Unemployment Rate, Inflation Rate, and Interest Rates, and technical indicators like Moving Averages, RSI, MACD, and Bollinger Bands.
Market indicators provide insights into market trends and economic health, helping investors decide when to buy or sell securities, manage risk, and diversify their portfolios.
While market indicators provide valuable insights, relying solely on them can be risky. It's advisable to use them in conjunction with other research tools and consider your financial goals, risk tolerance, and investment horizon.
No, market indicators are not infallible. They provide a snapshot of past and current economic conditions, and while they can help predict possible future trends, they are not guarantees of future outcomes. Interpreting these indicators within the broader economic and market context is crucial.
Global events, like a pandemic or geopolitical tensions, can significantly impact the economy and, in turn, affect market indicators. For example, these events might influence economic growth, employment rates, or investor sentiment, which are all reflected in various market indicators.
True Tamplin is a published author, public speaker, CEO of UpDigital, and founder of Finance Strategists.
True is a Certified Educator in Personal Finance (CEPF®), author of The Handy Financial Ratios Guide, a member of the Society for Advancing Business Editing and Writing, contributes to his financial education site, Finance Strategists, and has spoken to various financial communities such as the CFA Institute, as well as university students like his Alma mater, Biola University, where he received a bachelor of science in business and data analytics.
To learn more about True, visit his personal website or view his author profiles on Amazon, Nasdaq and Forbes.


