
The Ultimate Oscillator is a technical indicator developed in 1976 by Larry Williams for generating accurate buy and sell signals in financial markets. It achieves this by integrating price action over short-term, intermediate-term, and long-term periods, which sets it apart from traditional oscillators that focus on a single timeframe. The core aim is to capture momentum across these multiple horizons to reduce volatility and false transaction signals. As a result, the Ultimate Oscillator allows traders and investors to measure market momentum, predict price changes with greater precision, and make more informed decisions. This multi-period approach represents the growing demand for comprehensive market analysis tools in today's complex and rapidly-evolving financial markets. The Ultimate Oscillator's design draws from the understanding that momentum precedes price action in market movements. Williams believed that by using three different time periods to calculate momentum, traders could obtain a more holistic view of the market's state, reducing false signals and increasing the reliability of divergence signals. The Ultimate Oscillator uses three distinct time periods: short, medium, and long-term. This tri-window system weighs each period differently, attributing the most weight to the shortest timeframe and the least to the longest. This method helps smooth out price volatility and provides a clearer view of the market's momentum. The Ultimate Oscillator uses the concept of "buying pressure" to determine whether the market is bullish or bearish. When buying pressure exceeds selling pressure, it indicates a bullish trend; conversely, higher selling pressure implies a bearish trend. Understanding buying pressure is crucial to utilizing the Ultimate Oscillator effectively. To calculate the Ultimate Oscillator, you need several variables: the close, high, and low prices for the time period under analysis, as well as the previous period's close price. The first step involves calculating the true range and buying pressure. The true range is the greatest: current high minus current low, current high minus the previous close, or the previous close minus the current low. The buying pressure equals the current close minus the true low (which is the lower of the current low or the previous close). Next, you average the buying pressure and true range for each of the three time periods. This step gives the respective average buying pressure and true range for the short, medium, and long periods. You then divide the average buying pressure by the average true range for each time period to find the respective raw oscillators. These are then weighted and added together. The Ultimate Oscillator's value is obtained by multiplying the raw oscillator for each period by its weight, then summing these values and dividing by the sum of the weights. The final value ranges from 0 to 100, with higher values indicating overbought conditions and lower values implying oversold conditions. One practical use of the Ultimate Oscillator is to identify bullish and bearish divergences. A bullish divergence occurs when the oscillator increases while the price decreases, signaling a possible upward price movement. Conversely, a bearish divergence occurs when the oscillator decreases while the price is increasing, indicating a potential downward price movement. The Ultimate Oscillator is also adept at identifying overbought and oversold conditions. When the oscillator reaches high values (typically over 70), the market may be overbought, suggesting a potential price drop. Conversely, low oscillator values (generally below 30) might signify oversold conditions and potential price increases. The Ultimate Oscillator can help traders understand price action, the movement of a security's price over time. By comparing the oscillator's value to recent price movements, traders can discern potential trend reversals and formulate their trading strategies. The Ultimate Oscillator is most effective when used in conjunction with other technical indicators to confirm trends. Combining it with trend lines, moving averages, or volume indicators can provide a more reliable analysis and prevent false signals. One of the primary strengths of the Ultimate Oscillator is its multi-timeframe approach. This oscillator does not rely solely on a single period, like many other technical indicators. Instead, it uses three different timeframes in its calculations, thus providing a more comprehensive view of the market. This multi-faceted approach offers a broader perspective and can enhance the quality of trading signals it produces. False divergence signals are a common issue with single-period oscillators. These false signals can mislead traders, potentially leading to ill-advised trades. The Ultimate Oscillator stands out for its excellent ability to reduce these false divergence signals. This robust feature is particularly useful in volatile markets, where divergence signals can be unreliable. Another notable strength of the Ultimate Oscillator is its capacity to identify potential price reversals ahead of other indicators. Early identification of price reversals can provide traders with an edge, allowing them to react faster to changing market conditions and potentially capitalize on trading opportunities more effectively. The Ultimate Oscillator is a relatively complex indicator. Its calculations involve multiple timeframes and a variety of factors. This complexity can prove challenging for novice traders, who may find it hard to interpret and effectively utilize the indicator. Therefore, beginners may need to invest more time and effort to understand and use this tool effectively. While the Ultimate Oscillator is known for reducing false signals, it is not entirely immune to them. Especially in highly volatile markets, the oscillator may occasionally produce false signals. These inaccurate signals can lead traders into poorly-timed trades, thus potentially incurring losses. Another limitation of the Ultimate Oscillator is its decreased effectiveness in strongly trending markets. In these conditions, overbought or oversold statuses can persist for extended periods, and an oscillator might give a false signal of a trend reversal. Traders using the Ultimate Oscillator in such markets should approach it with caution and consider using it in conjunction with other technical indicators to validate signals. The Ultimate Oscillator can be a powerful tool in a variety of trading strategies. For instance, in a reversal strategy, traders can look for bullish or bearish divergences to anticipate price reversals. In a breakout strategy, traders might use the oscillator to confirm the breakout's strength and validity. To enhance accuracy and minimize false signals, traders often combine the Ultimate Oscillator with other technical indicators. For example, pairing it with a trend-following tool like moving averages can provide confirmation of trends and generate more reliable trading signals. Both the Ultimate Oscillator and RSI aim to identify overbought and oversold conditions. However, the RSI only uses one timeframe and can therefore give false signals during prolonged trends. The Ultimate Oscillator's multi-timeframe approach tends to offer more reliable signals in these situations. MACD is a trend-following momentum indicator, making it more suitable for identifying new trends rather than overbought or oversold conditions. The Ultimate Oscillator, while also a momentum tool, focuses on market extremities, offering different insights for traders. The Stochastic Oscillator and the Ultimate Oscillator both identify overbought and oversold conditions, but they differ in their calculations. The Stochastic Oscillator compares a security's closing price to its price range over a certain period, while the Ultimate Oscillator uses three timeframes and consders buying pressure. Ultimate Oscillator, a comprehensive technical indicator developed by Larry Williams, is instrumental in generating precise buy and sell signals by assessing price action across short-term, medium-term, and long-term periods. It helps mitigate false signals and enhance market trend understanding, thereby aiding in better trading decisions. The oscillator's multi-timeframe approach lends it a unique advantage over other single-period oscillators like RSI. Its utilization is, however, not without challenges, particularly for novice traders due to its complexity, and it may give false signals in volatile markets. Nevertheless, when used with other technical indicators, the Ultimate Oscillator offers a formidable tool for market analysis, trend prediction, and trading strategy formulation. Whether identifying bullish and bearish divergences, spotting overbought and oversold conditions, or understanding price action, the Ultimate Oscillator continues to hold its relevance in today's intricate financial markets.Ultimate Oscillator Overview
Principles of Ultimate Oscillator
Philosophy Behind the Ultimate Oscillator
Use of Three Different Time Periods
Importance of Buying Pressure to the Bull/Bear Decision
Calculation of the Ultimate Oscillator
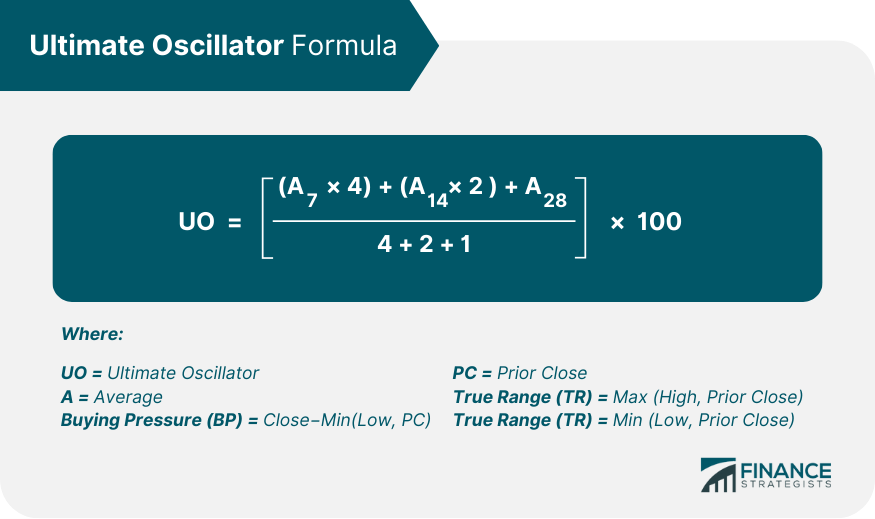
Variables Required for Calculation
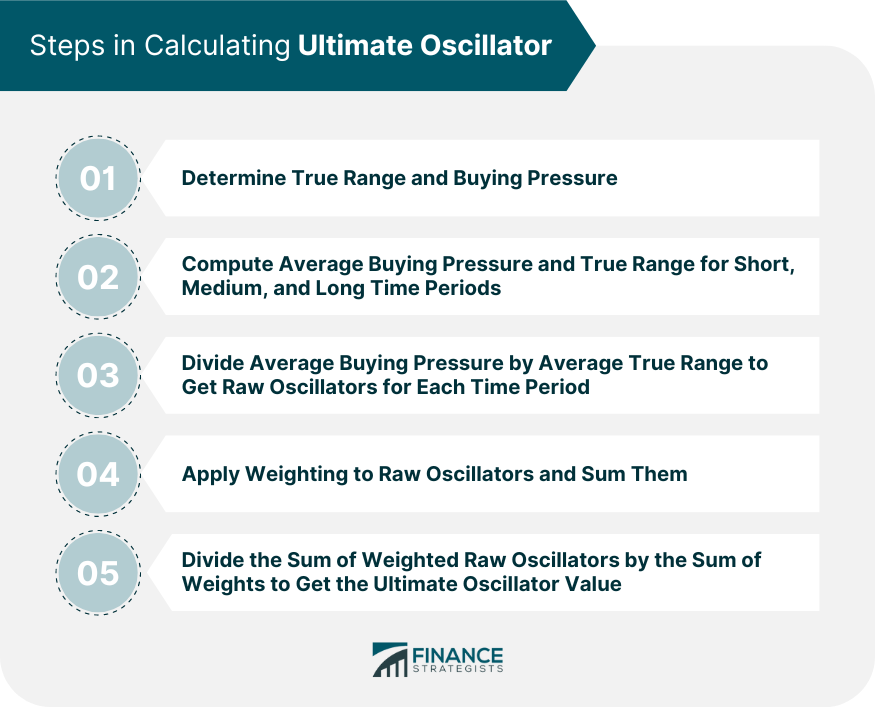
Step-By-Step Calculation Process
True Range and Buying Pressure
Average of Buying Pressure and True Range for the Three Time Periods
Calculation of the Raw Ultimate Oscillator
Final Calculation and Interpretation
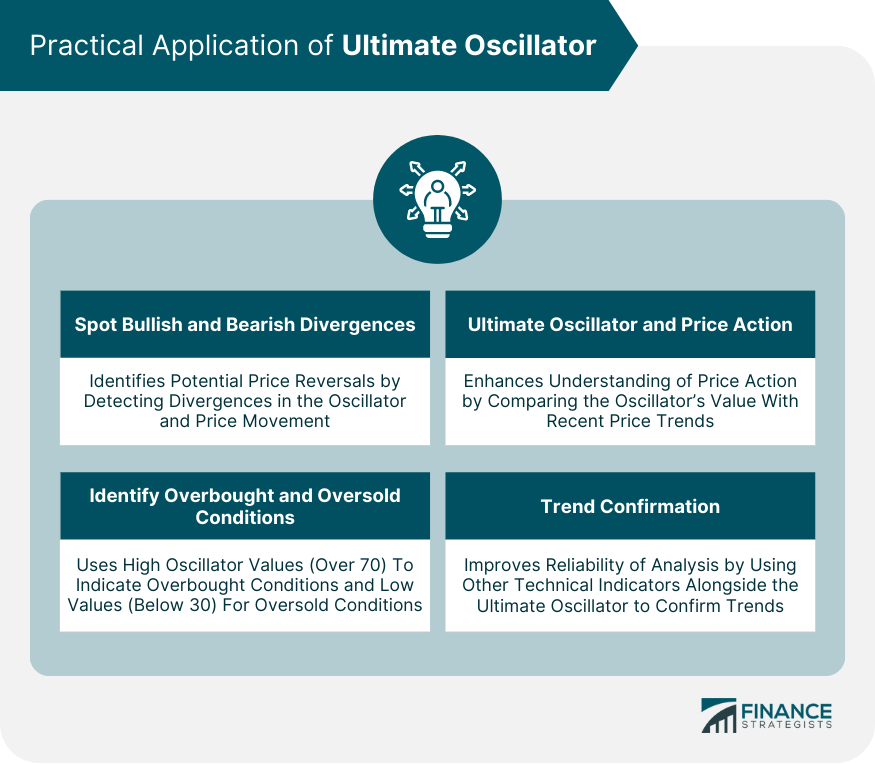
Practical Application of Ultimate Oscillator
Spotting Bullish and Bearish Divergences
Identifying Overbought and Oversold Conditions
Ultimate Oscillator and Price Action
Trend Confirmation
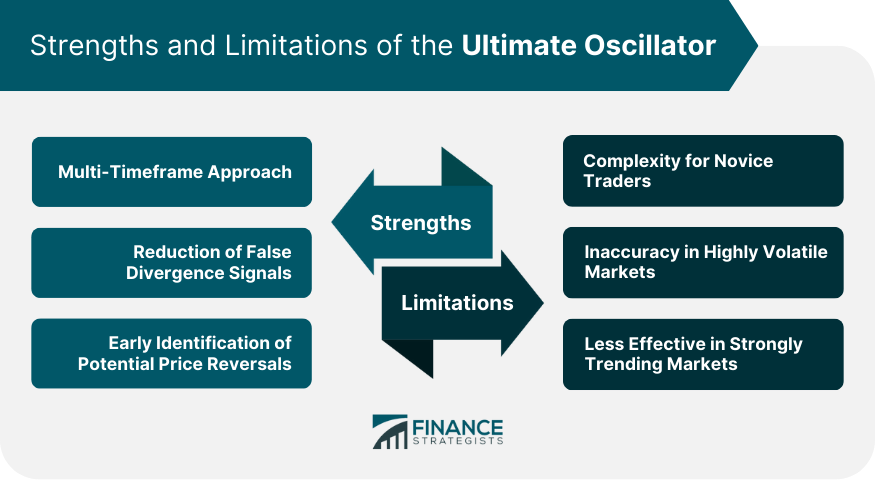
Strengths of the Ultimate Oscillator
Multi-Timeframe Approach
Reduction of False Divergence Signals
Early Identification of Potential Price Reversals
Limitations of the Ultimate Oscillator
Complexity for Novice Traders
Inaccuracy in Highly Volatile Markets
Less Effective in Strongly Trending Markets
Ultimate Oscillator in a Trading Strategy
Example Trading Strategies Using the Ultimate Oscillator
Combining the Ultimate Oscillator With Other Indicators
Comparison of Ultimate Oscillator and Other Oscillators
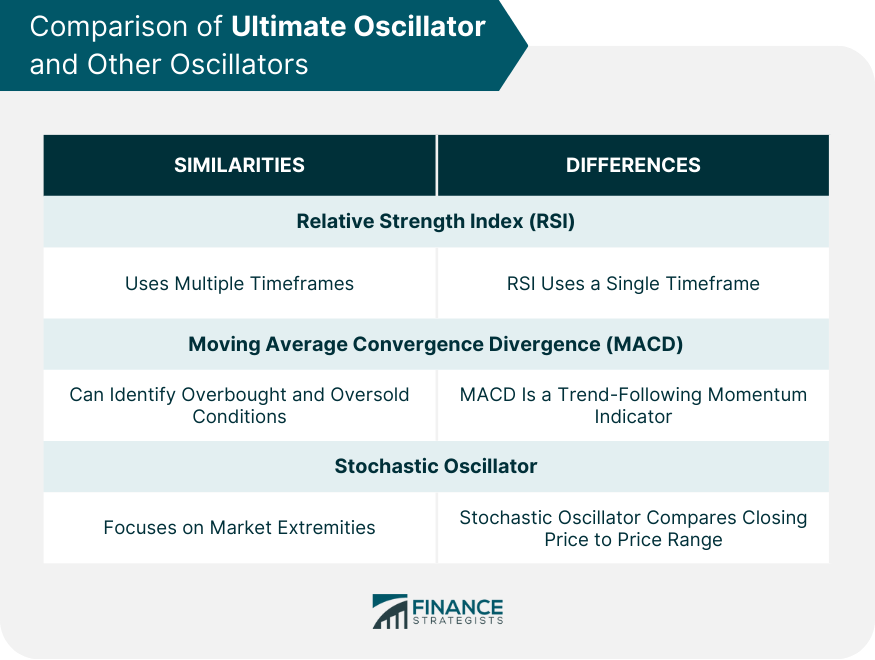
Ultimate Oscillator vs Relative Strength Index (RSI)
Ultimate Oscillator vs Moving Average Convergence Divergence (MACD)
Ultimate Oscillator vs Stochastic Oscillator
Final Thoughts
Ultimate Oscillator FAQs
The Ultimate Oscillator is a technical analysis tool used by traders to predict market conditions. Unlike traditional oscillators that rely on a single time period, the Ultimate Oscillator uses three different time periods to reduce volatility and noise in the market, providing more accurate trading signals.
The Ultimate Oscillator's calculation involves multiple steps. First, it computes the true range and buying pressure. It then averages these over three distinct time periods: short, medium, and long-term. Finally, these averages are combined into a raw oscillator value, which is then transformed into a final oscillator value ranging from 0 to 100.
The Ultimate Oscillator is used to spot bullish and bearish divergences and identify overbought and oversold market conditions. These provide potential indicators of future price movement. It's also used to confirm trends when used in conjunction with other technical indicators.
The primary benefit of the Ultimate Oscillator is its use of multiple timeframes, which provides a more comprehensive view of market conditions and reduces false signals. However, its complexity can be challenging for novice traders, and like all indicators, it's not always 100% accurate and can sometimes give false signals, particularly in volatile markets.
While all these indicators are used to analyze market trends, the Ultimate Oscillator's unique use of three time periods and focus on buying pressure set it apart. RSI may produce false signals during prolonged trends, MACD is more focused on identifying new trends rather than extreme market conditions, and the Stochastic Oscillator doesn't consider buying pressure. The Ultimate Oscillator's distinct approach tends to offer more reliable signals in various market conditions.
True Tamplin is a published author, public speaker, CEO of UpDigital, and founder of Finance Strategists.
True is a Certified Educator in Personal Finance (CEPF®), author of The Handy Financial Ratios Guide, a member of the Society for Advancing Business Editing and Writing, contributes to his financial education site, Finance Strategists, and has spoken to various financial communities such as the CFA Institute, as well as university students like his Alma mater, Biola University, where he received a bachelor of science in business and data analytics.
To learn more about True, visit his personal website or view his author profiles on Amazon, Nasdaq and Forbes.


