
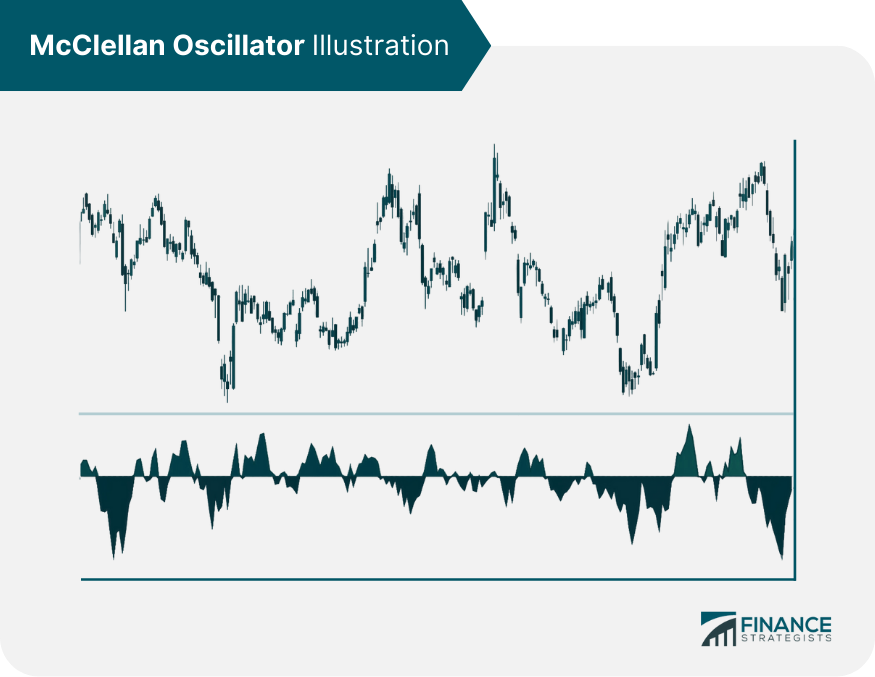
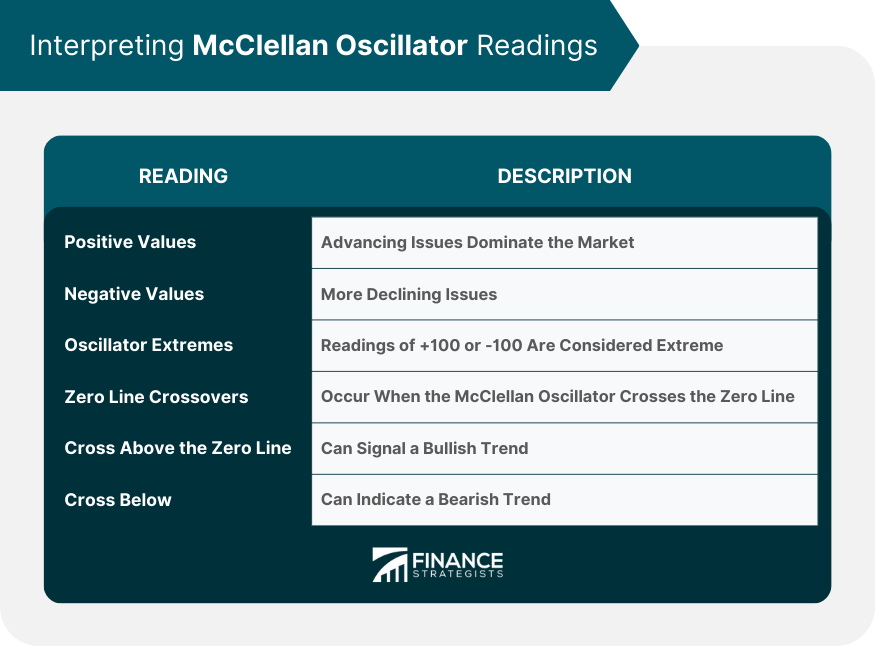
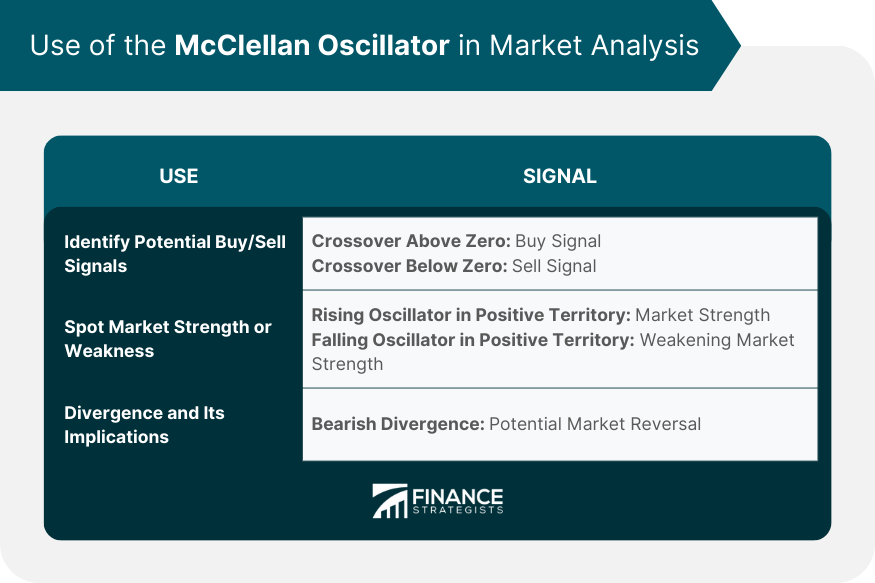
The McClellan Oscillator, a market breadth indicator created by Sherman and Marian McClellan, is used in technical analysis by traders and financial analysts. It calculates the difference between the 19-day and 39-day exponential moving averages of advancing and declining stock market issues, effectively measuring the momentum of securities contributing to market fluctuations. It serves as a gauge of the market's "health," showing the breadth of securities underpinning market movements. A positive value of the Oscillator typically indicates a bullish market trend with more securities rising than falling. On the other hand, a negative value implies a bearish market trend marked by more declining securities. Importantly, the McClellan Oscillator is instrumental in spotting overbought or oversold conditions, predicting potential trend reversals, and detecting divergences where market price trends contradict Oscillator trends. These insights prove crucial for making informed investment decisions. The McClellan Oscillator operates on the principle of market momentum and breadth. The Oscillator uses the difference between advancing and declining issues within the market and incorporates exponential moving averages (EMAs) into its calculation. The 19-day and 39-day EMAs are specifically used to capture both short-term and intermediate-term outlooks of market momentum. The mathematical formula for the McClellan Oscillator is as follows: 1. Start by noting the difference between Advances and Declines for 19 and 39 days on a stock exchange. 2. Next, compute a simple average for these differences, not an EMA. 3. Utilize these simple averages as the Prior Day EMA values in the 19- and 39-day EMA formulas. 4. Following this, calculate the 19- and 39-day EMAs. 5. Subsequently, calculate the McClellan Oscillator value. As a market breadth indicator, the McClellan Oscillator offers insights into the market's overall health. When the Oscillator is positive, it means there are more advancing issues, implying bullish market conditions. Conversely, a negative reading suggests more declining issues, indicating bearish market conditions. The McClellan Oscillator helps identify overbought and oversold conditions. When the oscillator moves above +70, it's considered overbought, signaling that a correction or downturn may be imminent. If it falls below -70, the market is considered oversold, and a reversal or upward movement could be on the horizon. The McClellan Oscillator can also detect market trends and divergences. Divergences occur when the oscillator and market prices move in opposite directions, potentially indicating a trend reversal. Positive values signal that advancing issues dominate the market, while negative values indicate more declining issues. These values can give traders a sense of the market's overall direction and momentum. McClellan Oscillator readings of +100 or -100 are considered extreme. These extremes often precede significant market reversals. However, they can also signal the continuation of a strong trend. A zero-line crossover occurs when the McClellan Oscillator crosses the zero line. A cross above the zero line can signal a bullish trend, while a cross below can indicate a bearish trend. The McClellan Oscillator can be used to identify potential buy or sell signals. When the oscillator crosses above zero, it can be a buy signal; when it crosses below zero, it may be a sell signal. However, confirming these signals with other indicators is essential to avoid false readings. The McClellan Oscillator can also help identify the strength or weakness of a market trend. For instance, if the market is trending up and the oscillator is also in positive territory and rising, this demonstrates market strength. If the market continues to rise, but the oscillator begins to fall, it could indicate weakening market strength. When the McClellan Oscillator diverges from the overall market trend, it can signal a potential market reversal. For example, if the market makes new highs but the oscillator fails to reach new highs, this bearish divergence could signal an upcoming downward trend. The Advance/Decline Line is a cumulative indicator that adds net advancing issues (advances minus declines) and doesn't involve any smoothing like the McClellan Oscillator. The Oscillator provides a more refined view of market breadth by using exponential moving averages to consider recent data more heavily than older data. The McClellan Summation Index is a long-term version of the McClellan Oscillator. It's a cumulative total of the oscillator readings. The Summation Index provides a broader view of market momentum, while the Oscillator is more sensitive to daily fluctuations. Relative Strength Index (RSI) and Stochastic Oscillators are momentum indicators that compare a security's closing price to its price range over a specific period. Unlike these oscillators, the McClellan Oscillator focuses on market breadth, providing a different perspective on the market's condition. One of the most significant advantages of the McClellan Oscillator is its ability to provide insights into the balance between market supply and demand. This feature allows traders to gauge the strength of a current market trend and potentially anticipate trend reversals before they occur. The McClellan Oscillator excels in identifying overbought or oversold conditions in the market. These conditions might not be readily apparent when focusing solely on price action, making this tool a valuable addition to any trader's toolkit. This advantage gives traders the opportunity to identify potential buying or selling opportunities that they might otherwise miss. Despite its advantages, the McClellan Oscillator can sometimes produce false signals. This is particularly common in choppy or volatile markets where price movements are irregular. As such, traders using the oscillator need to be aware of this limitation and take it into account when interpreting its signals. The McClellan Oscillator is considered a secondary indicator. This means that while it can provide useful insights and help identify potential trends, it should not be used as a standalone decision-making tool. For optimal results, it is best used in conjunction with other market indicators and analysis tools. Traders should always corroborate the signals generated by the McClellan Oscillator with other data before making a decision. The McClellan Oscillator is critical in technical analysis by helping traders determine the market's overall health. It also aids in understanding the underlying strength or weakness of a price trend. A real-life example of the McClellan Oscillator's usage was during the 2008 Financial Crisis. The Oscillator showed significant negative readings before the severe market downturn, potentially alerting traders to the incoming crisis. The McClellan Oscillator is a market breadth indicator that reveals the balance between buying and selling pressure. It is calculated based on advancing and declining issues and uses exponential moving averages for smoothing. The McClellan Oscillator is significant in financial analysis as it offers insights into overbought and oversold conditions and can help predict potential trend reversals. It's a valuable tool in market analysis, assisting in identifying potential buy/sell signals, spotting market strengths or weaknesses, and discerning divergence. While the McClellan Oscillator has its limitations, its role in financial analysis is substantial. It adds another dimension to analyzing market trends and provides a valuable perspective on the market's overall health. As with any financial tool, it should be used in conjunction with other indicators for the best results. Consider learning more about the McClellan Oscillator to enhance your financial strategies and wealth management further.What Is the McClellan Oscillator?
Understanding the McClellan Oscillator
Basic Concept
Formula and Calculation
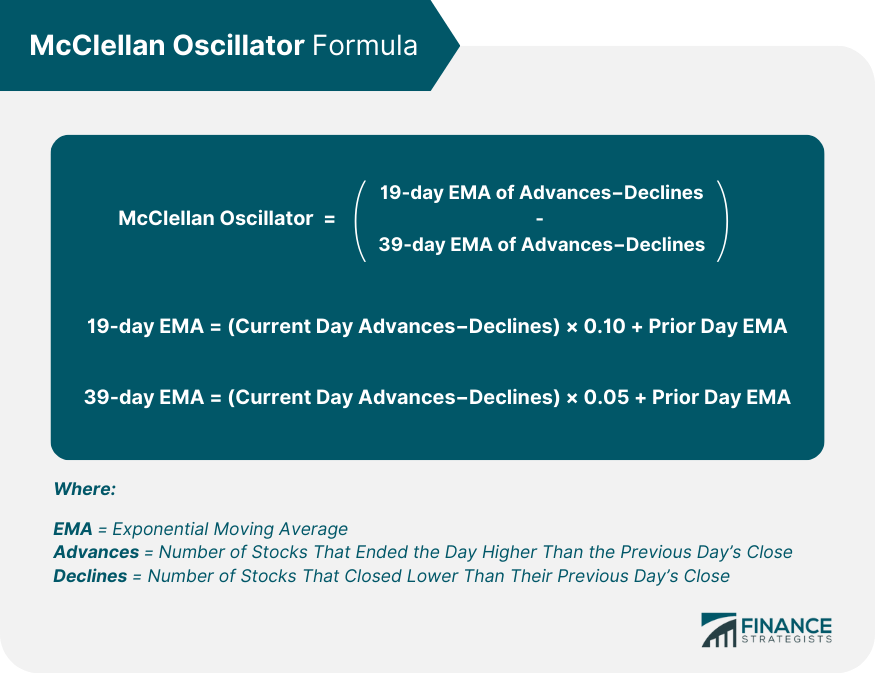
Steps to Calculate the McClellan Oscillator:
Significance of the McClellan Oscillator
Market Breadth Indicator
Overbought and Oversold Conditions
Detecting Market Trends and Divergences
Interpreting McClellan Oscillator Readings
Positive and Negative Values
Oscillator Extremes
Zero Line Crossovers
Use of the McClellan Oscillator in Market Analysis
Identifying Potential Buy/Sell Signals
Spotting Market Strength or Weakness
Divergence and Its Implications
McClellan Oscillator vs Other Market Indicators
Advance/Decline Line
McClellan Summation Index
Comparison With Other Oscillators (RSI, Stochastic)
Advantages of Using the McClellan Oscillator
In-Depth Market Insights
Identification of Market Conditions
Potential Drawbacks of Using the McClellan Oscillator
False Signals in Choppy Markets
Secondary Indicator Status
Practical Application of the McClellan Oscillator
Role in Technical Analysis
Examples of Real-Life Applications
Final Thoughts
McClellan Oscillator FAQs
The McClellan Oscillator is a market breadth indicator that helps assess the balance between buying and selling pressure in the market.
The Oscillator is calculated by subtracting the 39-day EMA of the difference between advancing and declining issues from the 19-day EMA of the same.
A positive Oscillator value suggests a bullish market with more advancing issues, while a negative value indicates a bearish market with more declining issues.
The Oscillator can help identify trend reversals through divergence. When the Oscillator and market prices move in opposite directions, it can signal a potential trend reversal.
Unlike price-based oscillators like the RSI or Stochastic, the McClellan Oscillator focuses on market breadth, providing a different perspective on the market's condition.
True Tamplin is a published author, public speaker, CEO of UpDigital, and founder of Finance Strategists.
True is a Certified Educator in Personal Finance (CEPF®), author of The Handy Financial Ratios Guide, a member of the Society for Advancing Business Editing and Writing, contributes to his financial education site, Finance Strategists, and has spoken to various financial communities such as the CFA Institute, as well as university students like his Alma mater, Biola University, where he received a bachelor of science in business and data analytics.
To learn more about True, visit his personal website or view his author profiles on Amazon, Nasdaq and Forbes.


