
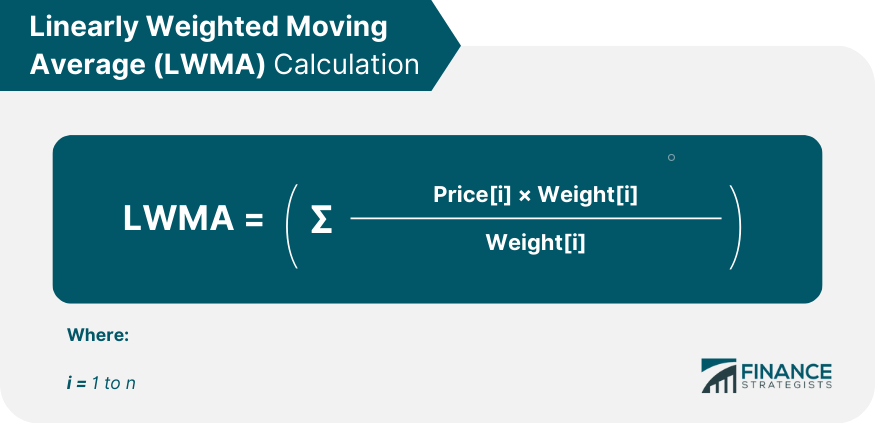
The Linearly Weighted Moving Average (LWMA), also known as the Weighted Moving Average, is a type of moving average that assigns a greater weight to the most recent data points. This technique helps traders more accurately reflect recent market changes in their analyses. LWMAs are widely used in financial trading, particularly in technical analysis, because of their sensitivity to price changes. Moving averages are fundamental to the field of technical analysis in financial trading. They smooth out price data, making it easier to spot trends and reversals in the market. There are several types of moving averages, including the Simple Moving Average (SMA), the Exponential Moving Average (EMA), and the LWMA. Each type has unique characteristics and uses, depending on a trader's strategy and the nature of the market being analyzed. The LWMA's increased sensitivity to recent data makes it a powerful tool for trend analysis. By emphasizing the latest price data, the LWMA responds more quickly to changes in a security's price, making it easier to identify the emergence of new trends or the reversal of existing ones. In fast-moving markets, the use of LWMAs can therefore provide a trader with a crucial edge. LWMAs are vital tools in trading and investment decision-making. Traders often use LWMAs as part of their technical analysis toolkit to generate trading signals, such as buying when a security's price rises above its LWMA or selling when it falls below. Additionally, by providing a clearer view of the underlying trend, LWMAs can help investors assess the risk associated with particular securities or portfolios. The calculation of the LWMA involves two main components: the data points (usually closing prices of security) and the weights assigned to these points. The most recent data point is assigned the greatest weight, the second most recent is given the second greatest weight, and so forth, until the oldest data point in the calculation period is assigned a weight of one. The LWMA is computed through the following steps: 1. Assign Weights: Begin with the oldest data point and assign a weight of 1. Incrementally increase the weight by one for each subsequent data point until you reach the most recent one. For example, if you are calculating a 5-day LWMA, assign weights of 1, 2, 3, 4, and 5 to the data points from the oldest to the most recent, respectively. 2. Multiply Each Data Point by Its Weight: Once the weights are assigned, multiply each data point by its corresponding weight. This results in a series of weighted data points. 3. Calculate the Sum of the Weighted Data Points: Add up the results of the multiplications done in the previous step. This sum represents the numerator in the LWMA formula. 4. Calculate the Sum of the Weights: Add up the weights that you assigned to the data points. This sum represents the denominator in the LWMA formula. 5. Divide the Sum of the Weighted Data Points by the Sum of the Weights: This gives you the LWMA. In mathematical terms, this can be represented as: Here, Price[i] is the security price at the ith time period, Weight[i] is the weight assigned to that price, and n is the number of time periods. This computation emphasizes recent prices, reflecting the belief that more recent prices are more relevant in predicting future price movements. As such, LWMA can be a valuable tool in technical analysis and trading. The Simple Moving Average (SMA) is the most basic type of moving average. It assigns equal weights to all data points in the calculation period. This means it is slower to respond to price changes than the LWMA. As a result, while SMAs can be useful in identifying long-term trends, they may not provide timely signals for short-term trading strategies. The Exponential Moving Average (EMA), like the LWMA, assigns greater weight to recent data points. The difference, however, is in the weighting mechanism. The EMA uses an exponential function to assign weights, while the LWMA uses a linear function. This makes the EMA even more sensitive to recent price changes than the LWMA. However, it also makes the EMA more prone to generating false signals, as it can overreact to minor price fluctuations. The LWMA's primary advantage is its sensitivity to recent data. Assigning higher weights to the most recent data points provides a more timely reflection of price changes. This can be particularly beneficial in volatile markets, where timely information is key to successful trading. The LWMA's responsiveness to recent data also makes it useful for short-term forecasting. Traders can use LWMAs to predict short-term price movements, enabling them to make timely trading decisions. However, it's important to note that, like all forecasting tools, LWMAs are not infallible and should be used in conjunction with other indicators and analysis techniques. While the LWMA's sensitivity to recent data is an advantage, it can also be a drawback. The LWMA can overreact to short-term price fluctuations, causing it to generate false signals. This can be particularly problematic in volatile markets, where price swings can be dramatic and short-lived. LWMAs, like all moving averages, are trend-following indicators. This means they work best in markets with clear upward or downward trends. LWMAs can produce many false signals in trendless or sideways markets, leading to potential losses for traders. In the field of technical analysis, the LWMA is often used as a trend-following indicator to detect shifts in price momentum. For instance, when the price of an asset crosses above its LWMA, it might signal a potential bullish trend, prompting a buy order. Conversely, when the price crosses below the LWMA, it might suggest a possible bearish trend, prompting a sell order. While the LWMA can be a powerful tool on its own, it is often combined with other technical indicators to create more robust trading strategies. For instance, the LWMA can be paired with the Relative Strength Index (RSI) to identify overbought or oversold conditions. In this approach, a trader might wait for the price to cross the LWMA in conjunction with an overbought or oversold signal from the RSI before entering a trade. Understanding LWMA charts is key to utilizing them effectively. An LWMA line is typically plotted over a price chart, giving traders a visual representation of the price trend. If the LWMA line rises, it suggests an upward price trend, whereas a falling LWMA line suggests a downward trend. When the price crosses the LWMA line, it may signal a change in trend. Certain patterns often emerge in LWMA charts, serving as trading signals. For example, a "golden cross" occurs when a short-term LWMA crosses above a long-term LWMA, indicating a bullish trend. Conversely, a "death cross" occurs when a short-term LWMA crosses below a long-term LWMA, suggesting a bearish trend. Linearly Weighted Moving Averages (LWMA) are powerful tools in financial trading, offering enhanced sensitivity to recent data, which makes them an excellent choice for short-term forecasting. They have a significant role in trend analysis, which is critical for investment and trading decisions. However, they have limitations, including increased noise sensitivity and limited effectiveness in trendless or sideways markets. As financial markets continue to evolve, so does the role of LWMA. With the advent of algorithmic trading, the use of LWMA is expected to increase. Algorithmic systems can automatically factor LWMAs into their trading strategies, taking advantage of their sensitivity to recent price changes to make real-time trading decisions. Understanding and applying concepts like the LWMA is just one part of effective wealth management. To maximize your investments' potential, consider seeking financial professionals' advice. They can help you understand the broader context, including market trends, economic indicators, and your personal financial situation, to guide you toward a strategy that fits your goals and risk tolerance.What Is the Linearly Weighted Moving Average?
The Importance of LWMAs in Financial Analysis
Role in Trend Analysis
Importance in Trading and Investment Decision-Making
Mathematical Formula of the LWMA
Understanding the Components
Step-By-Step Calculation Procedure
Comparison of LWMA With Other Moving Averages
Simple Moving Average (SMA)
Exponential Moving Average (EMA)
Advantages of Using the LWMA
Enhanced Sensitivity to Recent Data
Utility in Short-Term Forecasting
Limitations of the LWMA
Increased Noise Sensitivity
Limited Effectiveness in Trendless or Sideways Markets
Practical Applications of the LWMA in Trading
Use in Technical Analysis
Combination With Other Indicators for Trading Strategies
Understanding LWMA Charts
Reading and Interpreting LWMA Charts
Typical Patterns in LWMA Charts
Conclusion
Linearly Weighted Moving Average (LWMA) FAQs
The LWMA is a type of moving average that assigns more weight to recent data points, making it more responsive to price changes than other types of moving averages.
To calculate the LWMA, you assign weights to each data point in the calculation period (with the most recent data point given the highest weight), multiply each data point by its weight, sum the results, and then divide by the total of the weights.
Unlike the Simple Moving Average (SMA), which gives equal weight to all data points, the LWMA gives more weight to recent data. Compared to the Exponential Moving Average (EMA), which also gives more weight to recent data, the LWMA assigns weights linearly rather than exponentially.
The LWMA’s major advantage is its sensitivity to recent data, making it a valuable tool for detecting recent price changes and short-term forecasting.
The LWMA can be more prone to noise due to its sensitivity to recent data, leading to potential false signals. Furthermore, its effectiveness can be limited in markets without a clear upward or downward trend.
True Tamplin is a published author, public speaker, CEO of UpDigital, and founder of Finance Strategists.
True is a Certified Educator in Personal Finance (CEPF®), author of The Handy Financial Ratios Guide, a member of the Society for Advancing Business Editing and Writing, contributes to his financial education site, Finance Strategists, and has spoken to various financial communities such as the CFA Institute, as well as university students like his Alma mater, Biola University, where he received a bachelor of science in business and data analytics.
To learn more about True, visit his personal website or view his author profiles on Amazon, Nasdaq and Forbes.


