
The Relative Strength Index (RSI) is a popular technical analysis indicator used by traders and investors to measure the momentum of price movements in a financial instrument, such as stocks, commodities, or currencies. It was developed by J. Welles Wilder Jr. in 1978 and is typically represented as an oscillator, with values ranging from 0 to 100. RSI helps traders identify overbought or oversold conditions in the market, as well as potential trend reversals. It is calculated by comparing the average price gains to the average price losses over a specific period, usually 14 days. The RSI is a versatile tool that helps traders identify potential entry and exit points in the market. It can signal overbought and oversold conditions, indicate potential trend reversals, and confirm price movements. When combined with other technical indicators, the RSI can provide additional insights to improve trading strategies and enhance risk management. The RSI is calculated using the following formula: To compute the average gain and average loss, one must first calculate the difference in closing prices between consecutive days. Then, the average gain is calculated by summing up all the positive differences and dividing the sum by the specified period (usually 14 days). The average loss is calculated similarly, but using the negative differences. The RSI value is obtained by normalizing the RS to a scale of 0-100, with 100 indicating the strongest possible upward momentum and 0 signifying the strongest possible downward momentum. This normalization allows for easier interpretation and comparison of RSI values across different financial instruments and timeframes. RSI values above 70 typically indicate overbought conditions, suggesting that the asset may be overvalued and could potentially face a price correction. Conversely, RSI values below 30 signal oversold conditions, implying that the asset may be undervalued and could experience a price rebound. The mid-line at 50 can provide additional insights into the market's momentum. When the RSI is above 50, it indicates that the market is experiencing more gains than losses, suggesting a bullish sentiment. When the RSI is below 50, it reveals that the market is experiencing more losses than gains, pointing to bearish sentiment. Different RSI levels can offer unique insights into the market's behavior. For example, a steadily rising RSI may indicate a strengthening bullish trend, while a steadily falling RSI could signal a strengthening bearish trend. Additionally, a fluctuating RSI around the mid-line could suggest a range-bound market or a period of consolidation. Divergences occur when the price of an asset and the RSI move in opposite directions. A bullish divergence arises when the price makes lower lows while the RSI forms higher lows, indicating a potential trend reversal to the upside. Conversely, a bearish divergence occurs when the price makes higher highs while the RSI forms lower highs, signaling a potential trend reversal to the downside. Convergences can be used to confirm trend reversals after divergences. A convergence happens when the price and RSI move in the same direction, suggesting that the divergence may have led to a trend reversal. When the RSI and price both make higher highs or lower lows, it indicates a bullish or bearish convergence, respectively. Divergence and convergence patterns can provide essential validation signals for traders, helping them identify potential entry and exit points in the market. By considering both divergence and convergence, traders can enhance their trading strategies, reduce the risk of false signals, and improve their overall market analysis. Some traders use RSI as a standalone tool to develop their trading strategies. By monitoring overbought and oversold levels, identifying divergences and convergences, and considering the RSI's position relative to the mid-line, traders can make informed decisions about when to enter or exit the market. While the RSI can be a powerful tool on its own, it becomes even more potent when combined with other technical indicators. For instance, traders might use RSI alongside moving averages, trendlines, or chart patterns to refine their entry and exit points, enhance their understanding of the market, and improve their overall trading strategies. The RSI offers several advantages in market analysis, including its ability to identify overbought and oversold conditions, signal potential trend reversals, and confirm price movements. Moreover, the RSI is relatively easy to calculate and interpret, making it accessible to both novice and experienced traders. Despite its advantages, the RSI has some limitations. For example, the indicator can produce false signals, particularly in volatile or range-bound markets. Additionally, the RSI might remain in overbought or oversold territory for extended periods, challenging the timing of trades. As such, traders should use the RSI in conjunction with other technical indicators to minimize these limitations and enhance their market analysis. Traders must implement sound risk management practices when using RSI to develop trading strategies. This can involve setting appropriate stop-loss orders, determining position sizes based on risk tolerance, and periodically reviewing and adjusting trading strategies as market conditions change. The multi-timeframe analysis involves examining the RSI on different timeframes to gain a broader perspective on market trends and momentum. By considering both short-term and long-term timeframes, traders can identify potential areas of support and resistance, confirm trend reversals, and improve the accuracy of their trade entries and exits. Traders can draw trendlines on the RSI chart, just as they would on price charts, to identify support and resistance levels or detect potential trend reversals. Additionally, chart patterns such as double tops, double bottoms, head, and shoulders, or triangles can also form on the RSI chart, providing further insights into market behavior and potential trade opportunities. The relationship between RSI and volatility can offer valuable insights into market dynamics. For example, during periods of high volatility, the RSI may generate more frequent overbought and oversold signals. Conversely, during low volatility periods, the RSI might remain within a narrower range, making it more challenging to identify potential trade opportunities. By understanding the interplay between RSI and volatility, traders can better adapt their trading strategies to different market conditions. The Relative Strength Index (RSI) is a powerful technical analysis tool that helps traders identify potential entry and exit points in the market. With its ability to signal overbought and oversold conditions, indicate trend reversals, and confirm price movements, the RSI can provide valuable insights to improve trading strategies and risk management. As technology advances and trading tools evolve, the use of RSI is likely to become more sophisticated. Traders may combine RSI with machine learning algorithms, artificial intelligence, or other cutting-edge technologies to enhance their market analysis and develop more effective trading strategies. Understanding the RSI and its applications is essential for any trader or analyst seeking to excel in technical analysis. By learning how to calculate, interpret, and apply RSI in various market conditions, traders can develop more effective trading strategies, reduce risks, and ultimately improve their overall trading performance.Definition of Relative Strength Index (RSI)
Importance in Technical Analysis in RSI
Understanding the Calculation of RSI
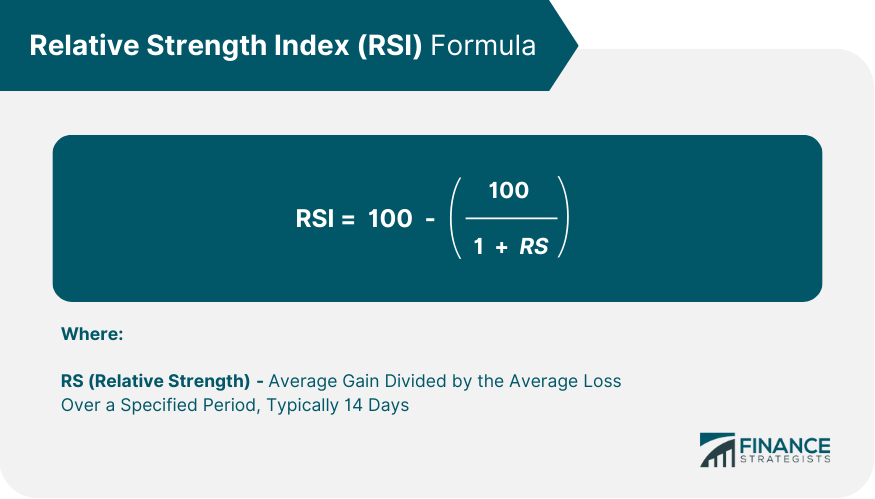
Explanation of the Mathematical Formula
Computing Average Gains and Losses
Normalization of the Ratio to a Scale of 0-100
Interpretation of RSI Values
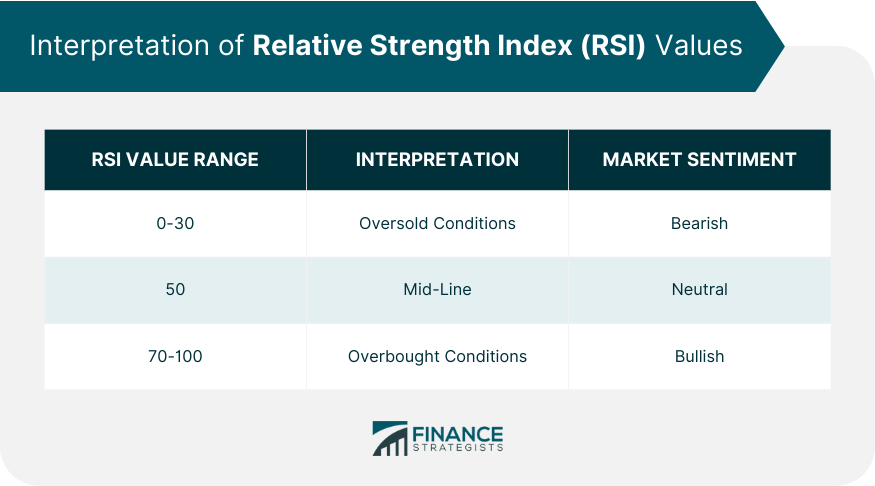
Overbought and Oversold Levels
Understanding the Mid-Line at 50
Implications of Varying RSI Levels
RSI Divergences and Convergences
Bullish and Bearish Divergences
Reversal Confirmation Through Convergences
Importance of Divergence and Convergence in Signal Validation
RSI and Trading Strategies
RSI as a Standalone Tool
RSI in Combination with Other Indicators
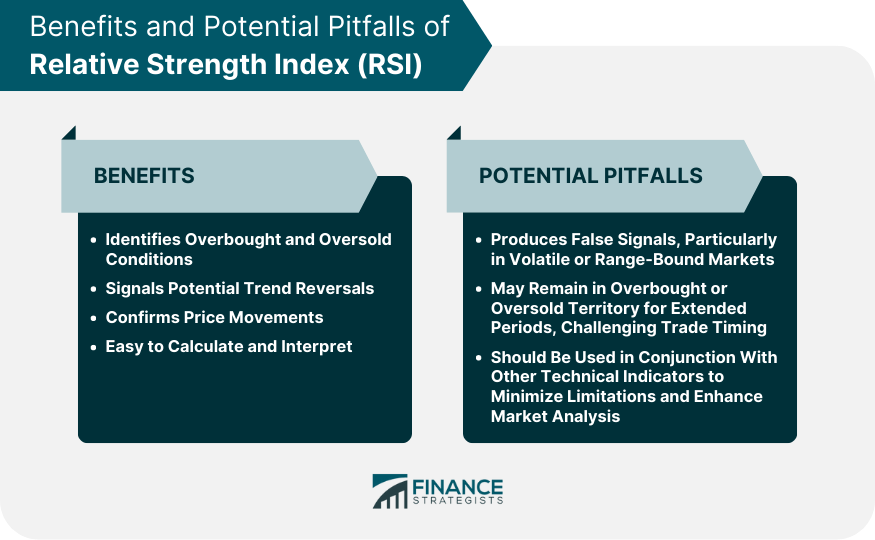
Advantages and Limitations of RSI
Benefits of Using RSI in Market Analysis
Potential Pitfalls and Limitations
Risk Management When Using RSI
Advanced RSI Concepts
Multi-Timeframe Analysis with RSI
RSI Trendlines and Chart Patterns
RSI and Volatility
Conclusion
Relative Strength Index (RSI) FAQs
The Relative Strength Index (RSI) is a momentum oscillator that measures the speed and change of price movements. It ranges from 0 to 100, with values above 70 indicating overbought conditions and values below 30 signaling oversold conditions. In technical analysis, traders use RSI to identify potential entry and exit points, potential trend reversals, and confirm price movements.
The RSI is calculated using the average gain and average loss over a specified period (typically 14 days). The formula is: RSI = 100 - (100 / (1 + RS)), where RS (Relative Strength) is the average gain divided by the average loss. The RSI value is then normalized to a scale of 0-100 for easier interpretation and comparison.
In the context of the RSI, overbought and oversold levels are typically represented by values above 70 and below 30, respectively. An RSI value above 70 suggests that an asset may be overvalued and could face a price correction, while an RSI value below 30 implies that an asset may be undervalued and could experience a price rebound.
Traders can use RSI divergences and convergences to identify potential trend reversals and validate trading signals. A divergence occurs when the price and RSI move in opposite directions, while a convergence happens when the price and RSI move in the same direction. By monitoring divergences and convergences, traders can enhance their trading strategies and improve their overall market analysis.
While the RSI offers valuable insights into market conditions, it has some limitations. For instance, it can produce false signals in volatile or range-bound markets, and it might remain in overbought or oversold territory for extended periods. To minimize these limitations, traders should use the RSI in conjunction with other technical indicators and apply sound risk management practices.
True Tamplin is a published author, public speaker, CEO of UpDigital, and founder of Finance Strategists.
True is a Certified Educator in Personal Finance (CEPF®), author of The Handy Financial Ratios Guide, a member of the Society for Advancing Business Editing and Writing, contributes to his financial education site, Finance Strategists, and has spoken to various financial communities such as the CFA Institute, as well as university students like his Alma mater, Biola University, where he received a bachelor of science in business and data analytics.
To learn more about True, visit his personal website or view his author profiles on Amazon, Nasdaq and Forbes.


