
A Descending Triangle is a bearish chart pattern used in technical analysis. This pattern is characterized by a lower horizontal trendline and a descending upper trendline, forming the shape of a right-angled triangle tilted to the left. Traders perceive it as a continuation pattern that forms during a downward trend, signaling a potential continued downward movement. In technical analysis, the Descending Triangle is considered a potent tool. It provides traders an opportunity to identify breakout points and formulate strategic trades accordingly. It plays a crucial role in the decision-making process, offering clues on entry points, stop losses, and profit targets. The upper trendline is formed by connecting a series of lower highs. Each subsequent high is lower than the previous one, creating a downward-sloping line. This trendline acts as a resistance level, indicating the downward pressure on the price. The lower trendline is drawn by connecting a series of lows that remain relatively flat or have a slight upward slope. This trendline acts as a support level, indicating a potential price floor. The upper and lower trendlines converge to form a triangle pattern. The convergence of the lines creates a narrowing range between the support and resistance levels, indicating a potential decrease in volatility. The volume analysis is essential when interpreting the descending triangle pattern. Typically, volume tends to diminish as the price approaches the apex of the triangle. A significant volume breakout is often seen as confirmation of a potential downward move. The descending triangle pattern is considered complete when the price breaks below the lower trendline, confirming the bearish nature of the pattern. The breakout is typically accompanied by an increase in volume, signaling the potential for a substantial downward move. To estimate the price target of the descending triangle, measure the height of the triangle pattern from the highest point to the horizontal trendline. Then, subtract that measurement from the breakout point. The resulting value can provide an approximate target for the downward move. Several tools can assist traders in identifying Descending Triangles. Charting software packages often include pattern recognition tools that help identify such patterns. Commonly used indicators like trendlines, moving averages, and volume bars can be instrumental. Understanding the psychology behind the pattern, i.e., diminishing demand and increasing supply, can be beneficial. Traders should be cautious about false breakouts, where price moves beyond the trendline but quickly reverses. Confirmation, usually with an increase in volume, is key for the successful identification. Generally, a break below the lower horizontal line indicates a selling signal, while a break above the descending trendline signifies a failure of the pattern and potentially marks a reversal to the uptrend. False breakouts are situations where the price appears to break out from the pattern but then swiftly reverses direction. It's crucial to wait for confirmation before executing trades based on a perceived breakout. Traders wait for a confirmed breakout below the lower trendline, accompanied by increased volume. Place a stop-loss order above the breakout point to protect against false breakouts. Use the height of the triangle pattern to estimate a potential price target. Subtract the height from the breakout point to determine the target. Take profits when the price reaches the target or consider trailing the stop-loss to capture additional gains. After the breakout, wait for the price to retest the broken lower trendline as a new resistance level. Look for signs of a rejection or bearish price action at the retest level, such as bearish candlestick patterns or a decrease in volume. Enter a short trade when the price shows a clear rejection at the retest level, with a stop-loss order placed above the resistance level. Set a profit target based on the estimated price target or previous support levels. Wait for the price to break below the lower trendline and experience a pullback or temporary price retracement. Look for signs of the pullback losing momentum, such as a decrease in volume or a failure to reach the previous resistance level (the broken lower trendline). Enter a short trade when the pullback shows signs of exhaustion or a reversal, with a stop-loss order placed above the recent swing high. Set a profit target based on the estimated price target or previous support levels. Consider purchasing put options on the underlying asset after the breakout, providing a way to profit from the anticipated downward move while limiting risk to the premium paid. Implement a bear put spread strategy by simultaneously buying a put option at a lower strike price and selling a put option at a higher strike price. This strategy helps reduce the cost of the trade but also limits the profit potential. Unlike the Descending Triangle, a Symmetrical Triangle has a downward and upward sloping trendline, suggesting indecision between buyers and sellers. The breakout direction is usually unknown until it occurs. The Ascending Triangle is the bullish counterpart of the Descending Triangle, with a flat upper trendline and an upward sloping lower trendline. It generally forms during an uptrend and signifies a continuation of the bullish market. Sometimes, the price may briefly break below the lower trendline but quickly reverse back into the triangle, leading to a false signal. Traders should exercise caution and wait for confirmation, such as a sustained move below the trendline with increased volume, before entering trades. The significance and reliability of the descending triangle pattern can vary depending on the timeframe being analyzed. Patterns observed on shorter timeframes, such as intraday charts, may have a higher likelihood of false signals and less reliable price targets compared to patterns on longer timeframes, like daily or weekly charts. The descending triangle pattern should not be considered in isolation but rather in the context of the overall market conditions and trend. It's crucial to consider the prevailing market sentiment, support and resistance levels, and other relevant factors. A descending triangle pattern within a strong uptrend, for example, may have a higher likelihood of being a continuation pattern rather than a reversal pattern. While the descending triangle pattern provides a potential price target based on the pattern's height, it's important to note that not all patterns reach their targets. Various factors, such as market volatility, news events, or changes in market sentiment, can influence the actual price movement. Traders should use the price target as a guide but also consider other supporting factors when determining profit targets and managing trades. In some cases, market manipulation or sudden influxes of high-volume trades can distort the expected patterns and breakouts. Traders should be cautious and not solely rely on technical patterns like the descending triangle. Monitoring market news and events can help identify potential risks associated with manipulation. The descending triangle pattern is a valuable tool in technical analysis for traders. It serves as a continuation pattern during a downward trend, providing insights into potential breakout points and strategic trading opportunities. By recognizing the structure of the descending triangle, understanding the pattern's interpretation, and employing effective strategies, traders can harness its power to make informed decisions. However, it is important to be aware of the limitations and risks associated with the descending triangle pattern. False breakouts can occur, necessitating confirmation before entering trades. The timeframe being analyzed can also impact the pattern's reliability and price target accuracy. Additionally, market context and external factors should be considered to avoid potential market manipulation and unexpected price movements. By using the descending triangle pattern as part of a comprehensive trading approach, traders can enhance their decision-making process and increase their chances of success in the market. Beginner traders might seek professional guidance when learning to identify and trade based on the Descending Triangle, as incorrect identification can lead to significant losses.What Is a Descending Triangle?
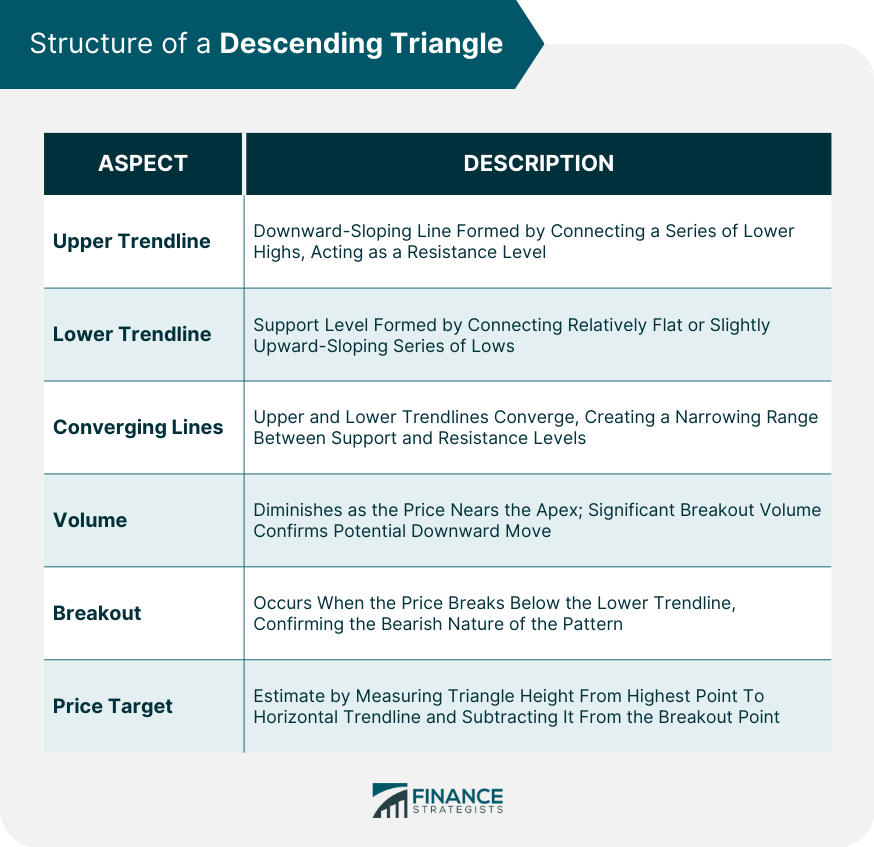
Structure of a Descending Triangle
Upper Trendline
Lower Trendline
Converging Lines
Volume
Breakout
Price Target
Recognizing a Descending Triangle in Market Trends
Tools to Identify the Pattern
Tips for Correct Identification
Interpretation of the Descending Triangle
Typical Interpretation
False Breakouts
Trading Strategies Involving the Descending Triangle
Breakout Trading
Entry
Stop-Loss
Target
Retest Strategy
Entry
Confirmation
Entry Confirmation
Target
Pullback Strategy
Entry
Confirmation
Entry Confirmation
Target
Options Strategies
Bearish Put Options
Bear Put Spreads
Descending Triangle vs Other Chart Patterns
Comparison With Symmetrical Triangle
Comparison With Ascending Triangle
Descending Triangle Limitations and Risks
False Breakouts
Timeframe Dependence
Market Context
Price Target Accuracy
Market Manipulation
Final Thoughts
Descending Triangle FAQs
A Descending Triangle is a bearish chart pattern used in technical analysis, often signaling a continuation of a downward trend.
It is formed by a lower horizontal trendline and a descending upper trendline, signifying a balance between decreasing demand and constant supply.
Traders generally enter a short position once a confirmed breakout from the lower trendline occurs, setting stop losses slightly above the most recent high within the triangle, and profit targets equivalent to the height of the pattern.
Unlike a Symmetrical Triangle, which has no definite bias, a Descending Triangle is bearish. On the other hand, an Ascending Triangle, its bullish counterpart, signals potential upward movements.
Risks include false breakouts and the impact of high market volatility, which can lead to more false signals and potential losses.
True Tamplin is a published author, public speaker, CEO of UpDigital, and founder of Finance Strategists.
True is a Certified Educator in Personal Finance (CEPF®), author of The Handy Financial Ratios Guide, a member of the Society for Advancing Business Editing and Writing, contributes to his financial education site, Finance Strategists, and has spoken to various financial communities such as the CFA Institute, as well as university students like his Alma mater, Biola University, where he received a bachelor of science in business and data analytics.
To learn more about True, visit his personal website or view his author profiles on Amazon, Nasdaq and Forbes.


