
Bollinger Bands is a widely used technical analysis tool that was developed by John Bollinger in the early 1980s. It is a chart indicator that consists of a moving average and two standard deviation bands, one above and one below the moving average. Bollinger Bands are used to identify the volatility of an asset and to determine overbought and oversold conditions. John Bollinger, a financial analyst, developed Bollinger Bands in the early 1980s. He was looking for a way to measure volatility in the stock market and developed a mathematical formula that used standard deviation to create the upper and lower bands. Bollinger Bands were first introduced in his book, "Bollinger on Bollinger Bands," which was published in 2001. Since then, Bollinger Bands have become one of the most popular technical analysis tools among traders and investors. The purpose of Bollinger Bands is to measure the volatility of an asset and to identify overbought and oversold conditions. By analyzing the width of the bands, traders can determine the level of volatility in an asset. The tighter the bands, the lower the volatility, and the wider the bands, the higher the volatility. Bollinger Bands are also used to identify overbought and oversold conditions. When an asset's price touches the upper band, it is considered overbought, and when it touches the lower band, it is considered oversold. The first step in constructing Bollinger Bands is to calculate the moving average. The moving average is the average price of an asset over a specific period. Typically, traders use the 20-day moving average, but it can be adjusted based on the trader's preference. The moving average is calculated by adding up the closing prices of an asset over a specific period and dividing it by the number of periods. The next step is to calculate the standard deviation. Standard deviation is a statistical measure that calculates how much an asset's price varies from the average price. The standard deviation is calculated by subtracting the moving average from the closing price, squaring the result, and then summing up all the squared results over the specified period. The sum is then divided by the number of periods and then taking the square root of the result. The upper and lower bands are created by adding and subtracting the standard deviation from the moving average. The upper band is calculated by adding two standard deviations to the moving average, and the lower band is calculated by subtracting two standard deviations from the moving average. Bollinger Bands are used to identify the volatility of an asset. When the bands are close together, it indicates that the asset is experiencing low volatility. When the bands are far apart, it indicates that the asset is experiencing high volatility. Traders can use this information to make informed decisions about when to enter or exit a trade. Bollinger Bands are also used to identify overbought and oversold conditions. When an asset's price touches the upper band, it is considered overbought, and when it touches the lower band, it is considered oversold. Bollinger Bands are also used to identify trends in the market. When an asset is in an uptrend, the price tends to stay above the moving average, and the upper band tends to act as a resistance level. Conversely, when an asset is in a downtrend, the price tends to stay below the moving average, and the lower band tends to act as a support level. Traders can use this information to determine the direction of the trend and to make informed trading decisions. The Bollinger Bands Squeeze is a trading strategy that is used when the bands are close together, indicating low volatility. When the bands are tight, it suggests that the asset is consolidating, and a breakout is imminent. Traders can use this information to buy or sell an asset when the price breaks out of the bands. The Bollinger Bands Breakout strategy is used when the price of an asset breaks through the upper or lower band. When the price breaks above the upper band, it suggests that the asset is experiencing upward momentum, and traders can use this information to enter a long position. Conversely, when the price breaks below the lower band, it suggests that the asset is experiencing downward momentum, and traders can use this information to enter a short position. The Bollinger Bands Reversal strategy is used when an asset's price reaches the upper or lower band but fails to break through it. When the price touches the upper band and then begins to fall, it suggests that the asset is overbought and a reversal is imminent. Conversely, when the price touches the lower band and then begins to rise, it suggests that the asset is oversold, and a reversal is imminent. Bollinger Bands are easy to use and understand. Traders can quickly identify overbought and oversold conditions, as well as trends and volatility levels. Bollinger Bands can be used on any asset class, including stocks, commodities, and currencies. Traders can adjust the parameters to suit their trading style and the asset they are trading. Bollinger Bands have been extensively tested and are considered to be a reliable indicator of market conditions. Traders can use this tool to make informed trading decisions with a high level of confidence. Bollinger Bands should not be used as a standalone indicator. Traders should use other technical analysis tools, such as volume indicators and oscillators, to confirm signals and make informed trading decisions. Bollinger Bands can sometimes produce false signals. Traders should use caution when using this tool and should always confirm signals with other indicators and analysis. Bollinger Bands are dependent on market conditions, and the parameters may need to be adjusted to suit the asset being traded. Traders should always monitor market conditions and adjust the parameters accordingly. Bollinger Bands are a widely used technical analysis tool that measures volatility and identifies overbought and oversold conditions. The tool consists of a moving average and two standard deviation bands, one above and one below the moving average. Bollinger Bands are an important tool in trading and can help traders make informed trading decisions. Traders can use the tool to identify trends, volatility levels, and overbought and oversold conditions. The use of Bollinger Bands is likely to remain popular in the future, as traders continue to seek reliable tools to help them make informed trading decisions. However, traders should also be aware of the limitations of the tool and should use other technical analysis tools to confirm signals and make informed trading decisions. Bollinger Bands are a useful technical analysis tool that can help traders identify market trends, volatility levels, and overbought and oversold conditions. Traders can use the tool in a variety of trading strategies, including the Bollinger Bands Squeeze, Bollinger Bands Breakout, and Bollinger Bands Reversal. While the tool has its limitations, it remains an important part of a trader's toolkit and can help them make informed trading decisions with a high level of confidence.What Are Bollinger Bands?
Construction of Bollinger Bands
Calculation of Moving Average
Calculation of Standard Deviation
Upper and Lower Bands
Interpretation of Bollinger Bands
Volatility
Overbought/Oversold Conditions
Traders can use this information to determine when to buy or sell an asset.Trend Identification
Trading Strategies Using Bollinger Bands
Bollinger Bands Squeeze
Bollinger Bands Breakout
Bollinger Bands Reversal
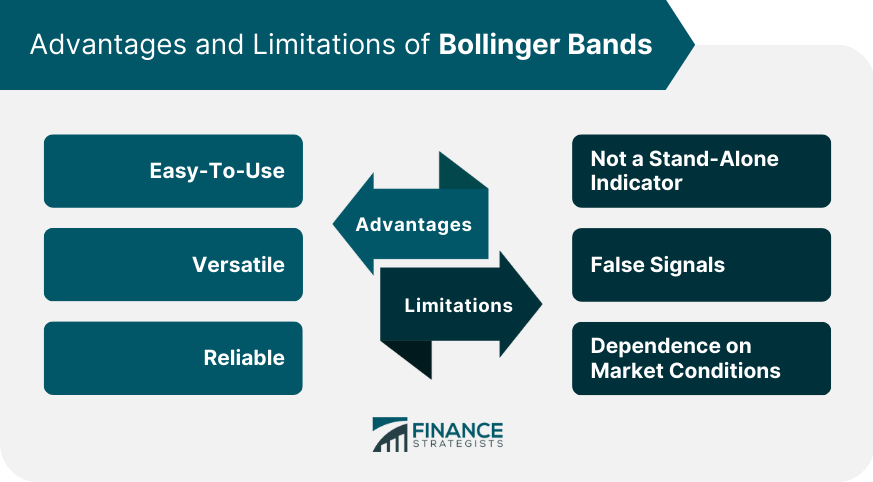
Advantages of Bollinger Bands
Easy-To-Use
Versatile
Reliable
Limitations of Bollinger Bands
Not a Stand-Alone Indicator
False Signals
Dependence on Market Conditions
Conclusion
Bollinger Bands FAQs
Bollinger Bands are a technical analysis tool used to measure market volatility by plotting two standard deviations away from a moving average.
Bollinger Bands are calculated by adding and subtracting two standard deviations from a moving average. The standard deviation measures the variability of price in the market.
When the price is within the bands, it is considered to be in a normal range. When the price moves outside the bands, it is considered to be an indication of a trend reversal.
Some common trading strategies include the Bollinger Band Squeeze, which looks for low volatility periods followed by high volatility, and the Bollinger Breakout, which looks for a breakout from the bands.
Yes, Bollinger Bands can be used for any market, including stocks, options, futures, and currencies. However, it is important to adjust the settings for different markets and timeframes.
True Tamplin is a published author, public speaker, CEO of UpDigital, and founder of Finance Strategists.
True is a Certified Educator in Personal Finance (CEPF®), author of The Handy Financial Ratios Guide, a member of the Society for Advancing Business Editing and Writing, contributes to his financial education site, Finance Strategists, and has spoken to various financial communities such as the CFA Institute, as well as university students like his Alma mater, Biola University, where he received a bachelor of science in business and data analytics.
To learn more about True, visit his personal website or view his author profiles on Amazon, Nasdaq and Forbes.


