
In the realm of technical analysis, the term "oversold" describes a situation in which the price of a security or market sector has declined so steeply—and usually so quickly—that, according to technical indicators, it is due for a bounce. In a way, it is like an overreaction from the market where the sell-offs have been excessive. However, this term does not necessarily imply that the underlying security is undervalued—only that it is heavily sold. Understanding oversold conditions is vital for traders because it can signify potential investment opportunities. When a stock is oversold, it could mean that the stock is trading below its true value, which could create an opportunity for buying at a low price. However, timing is crucial, as buying too soon can lead to substantial losses. A deep comprehension of oversold conditions can thus provide traders with an edge in navigating volatile markets. When investors grow fearful due to negative news or market trends, they sell their holdings, increasing the supply of the stock on the market. If this selling activity is extensive, it can outpace demand, causing the price to drop sharply—thus leading to oversold conditions. When pessimism pervades the market, selling pressure can intensify, driving prices down and potentially leading to oversold conditions. It's worth noting that oversold conditions can often be short-lived, especially if they're driven primarily by sentiment rather than underlying economic factors. The RSI is a momentum oscillator that measures the speed and change of price movements. It is typically used on a 14-day timeframe and oscillates between 0 and 100. Generally, a stock is considered oversold when the RSI drops below 30. This suggests that the stock is being heavily sold, and could potentially rebound. However, just because a stock is oversold does not necessarily mean it's time to buy. Traders often wait for the RSI to move back above 30 before making a purchase. The Stochastic Oscillator compares a particular closing price of a security to a range of its prices over a certain period. This range is typically set to 14 periods. The stochastic oscillator uses a scale to measure the degree of change between prices from one closing period to predict the continuation of the current direction trend. Values below 20 are considered oversold, indicating that the price is near the bottom of its high-low range. This could be a signal of a bullish reversal. CCI was initially developed for commodities, but it has become a popular tool for all types of markets. CCI measures a security's variation from its statistical mean. High values show that prices are unusually high compared to the average price, and low values show that prices are unusually low. In terms of oversold conditions, a CCI value that falls below -100 signifies that the asset may be oversold and may be due for a price bounce. MACD is a trend-following momentum indicator that shows the relationship between two moving averages of a security’s price. The MACD is calculated by subtracting the 26-period Exponential Moving Average (EMA) from the 12-period EMA. The result of that calculation is the MACD line. A nine-day EMA of the MACD, called the "signal line," is then plotted on top of the MACD line, which can function as a trigger for buy and sell signals. When the MACD line crosses above the signal line, it could be a bullish sign and an oversold condition may be ending. During intraday trading, oversold conditions may occur and reverse within a very short period. These quick reversals can be lucrative for day traders who can act quickly to capitalize on these price fluctuations. Swing traders, who generally operate on a timeframe of a few days to several weeks, can also benefit from recognizing oversold conditions. An oversold stock may present an opportunity for a swing trader to enter a position before a potential price rebound. For position traders, who hold stocks for months or even years, oversold conditions can represent key points to enter or exit long-term positions. Spotting these conditions requires a careful review of long-term price charts and a solid understanding of the underlying fundamentals. An important aspect of technical analysis is distinguishing between a strong downtrend and an oversold condition. A stock can remain oversold for an extended period while being in a strong downtrend. Hence, it is important to not mistake oversold for being the same as a price bottom. A truly oversold condition generally precedes a price increase. Confirming signals are vital in verifying oversold conditions. These signals can be a subsequent bullish candlestick pattern, a positive divergence in an oscillator, or a high-volume bullish reversal pattern. It's always wise for traders to seek confirmation before acting on potential oversold signals. The basic strategy for trading oversold stocks is to "buy the bounce." This means buying a stock after it has reached an oversold level and started to rebound. Another strategy is to wait for the stock to break a trend line. This strategy provides a bit more confirmation than simply buying the bounce, as it indicates that the overall trend may be changing. This strategy involves identifying divergence between price action and an oscillator, such as the RSI. When prices continue to fall, but the oscillator begins to rise, it suggests that the downward momentum is waning and a reversal may be forthcoming. High trading volume often accompanies key reversal points. Thus, a surge in volume during an oversold bounce can provide additional confirmation of a potential price reversal. Oversold conditions can sometimes produce false reversal signals, leading traders to enter positions prematurely. This is known as a "bear trap," as the supposed price reversal can quickly reverse course, trapping traders in unprofitable positions. A stock can remain in oversold conditions longer than a trader can stay solvent. Even if a stock appears oversold, it can still drop further, leading to significant losses for traders who enter positions too early. Oversold stocks are often highly volatile, and this can lead to large price swings that can result in substantial losses. Some oversold stocks may lack liquidity, making it difficult for traders to exit positions. This can exacerbate losses, especially in fast-moving markets. Oversold conditions occur when a security or market sector experiences a sharp and rapid decline in price, often due to excessive selling and negative market sentiment. While these can present potential investment opportunities, traders must exercise caution, employ appropriate strategies, and utilize technical indicators to navigate these situations effectively. By utilizing indicators such as the RSI, Stochastic Oscillator, CCI, and MACD, traders can gauge whether a security is oversold and potentially due for a rebound. Different timeframes, from intraday trading to swing trading and position trading, require specific strategies to capitalize on oversold conditions. Analyzing chart patterns can also provide confirmation of oversold conditions, but it is important to differentiate them from strong downtrends. Strategies such as buying the bounce, waiting for trend line breaks, divergence trading, and volume analysis can help traders make informed decisions and minimize risks associated with false signals, prolonged oversold conditions, high volatility, and lack of liquidity. A deep understanding of oversold conditions, combined with proper risk management, can provide traders with an edge in navigating volatile markets and maximizing their trading success.What Is Oversold?
Mechanism of Oversold Conditions
Effects of Supply and Demand
Role of Market Sentiment
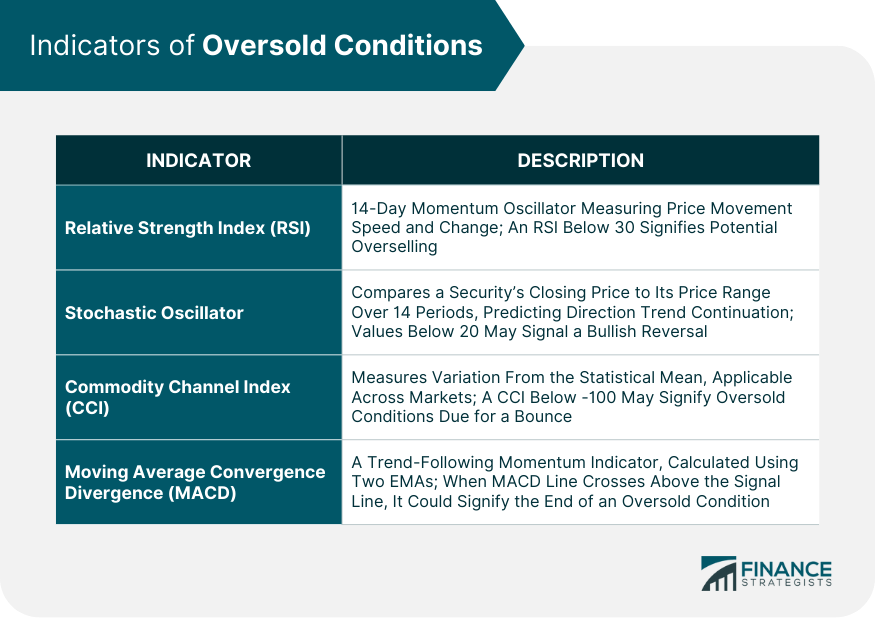
Indicators of Oversold Conditions
Relative Strength Index (RSI)
Stochastic Oscillator
Commodity Channel Index (CCI)
Moving Average Convergence Divergence (MACD)
Oversold Conditions in Different Timeframes
Short-Term Periods (Intraday Trading)
Mid-Term Periods (Swing Trading)
Long-Term Periods (Position Trading)
Oversold vs Strong Downtrend
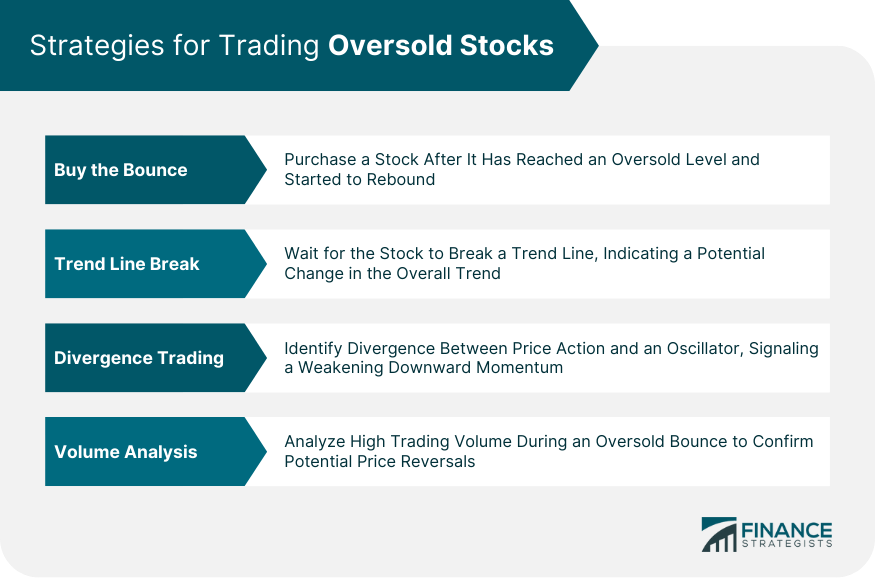
Strategies for Trading Oversold Stocks
Buy the Bounce
Trend Line Break
Divergence Trading
Volume Analysis
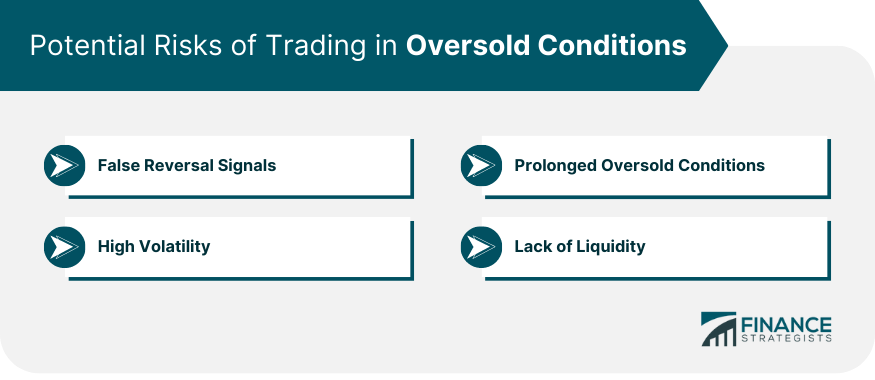
Potential Risks of Trading in Oversold Conditions
False Reversal Signals
Prolonged Oversold Conditions
High Volatility
Lack of Liquidity
Final Thoughts
Oversold FAQs
When a stock is oversold, it means that the price of the stock has declined steeply and quickly, often driven by excessive selling. According to technical indicators, an oversold condition suggests that the stock is due for a potential bounce or price increase.
No, an oversold condition does not necessarily mean that the underlying stock is undervalued. It simply indicates that the stock has been heavily sold and may be due for a rebound. Other factors, such as fundamental analysis, are needed to determine the true value of a stock.
Technical indicators, such as the Relative Strength Index (RSI), Stochastic Oscillator, Commodity Channel Index (CCI), and Moving Average Convergence Divergence (MACD), utilize mathematical calculations based on price and volume to identify potential oversold conditions. These indicators provide insights into the momentum and price movements of a security, helping traders determine if it may be oversold.
Trading oversold stocks carries certain risks. False reversal signals can mislead traders into entering positions prematurely, while prolonged oversold conditions can lead to further price declines. Additionally, oversold stocks are often highly volatile, which can result in substantial price swings and potential losses. Traders may also encounter difficulties exiting positions due to the lack of liquidity in some oversold stocks.
Several strategies can be employed when trading oversold stocks. "Buying the bounce" involves purchasing a stock after it has reached an oversold level and started to rebound. Waiting for a trend line break provides additional confirmation of a potential trend reversal. Divergence trading involves identifying divergence between price action and an oscillator, indicating a weakening downward momentum. Volume analysis can also help confirm oversold conditions, as high trading volume often accompanies key reversal points. It is important for traders to select strategies that align with their trading goals and risk tolerance.
True Tamplin is a published author, public speaker, CEO of UpDigital, and founder of Finance Strategists.
True is a Certified Educator in Personal Finance (CEPF®), author of The Handy Financial Ratios Guide, a member of the Society for Advancing Business Editing and Writing, contributes to his financial education site, Finance Strategists, and has spoken to various financial communities such as the CFA Institute, as well as university students like his Alma mater, Biola University, where he received a bachelor of science in business and data analytics.
To learn more about True, visit his personal website or view his author profiles on Amazon, Nasdaq and Forbes.


