
The Moving Average Convergence Divergence is a robust and versatile trend-following momentum indicator in technical analysis that reveals changes in the strength, direction, momentum, and duration of a trend in a stock's price. Developed by Gerald Appel in the late 1970s, MACD is calculated by subtracting the 26-period Exponential Moving Average (EMA) from the 12-period EMA. The result of that subtraction is the MACD line. A 9-day EMA of the MACD, called the "signal line," is then plotted on top of the MACD line, which can function as a trigger for buy and sell signals. MACD is essential in technical analysis because of its versatility. It can be used to identify potential buy and sell points, evaluate the strength of an ongoing trend, and estimate when a trend reversal may occur. Furthermore, MACD's utility across different timeframes and markets makes it an invaluable tool for both short-term traders and long-term investors. The MACD line is the heart of the indicator and provides the clearest signals. It's the result of subtracting the 26-day EMA from the 12-day EMA. When the MACD line crosses above the signal line, it generates a bullish signal, indicating it may be a good time to buy. Conversely, when it crosses below, it's a bearish signal, suggesting it might be a good time to sell. The signal line is a 9-day EMA of the MACD line. This line triggers trading signals when it is crossed by the MACD line. The zero line is the point at which the MACD and signal lines intersect when they are equal. Zero line crossovers can indicate trend changes – positive values denote bullish markets, while negative values signify bearish conditions. The MACD histogram shows the difference between the MACD line and the signal line. When the histogram is above zero (MACD line above the signal line), it signals bullish conditions. On the other hand, when the histogram is below zero, it indicates bearish conditions. The mathematics behind MACD involves exponential moving averages and their subtraction. The MACD line's calculation is simple: it's the difference between the 12-day EMA and the 26-day EMA of a given security's price. The signal line is then calculated as the 9-day EMA of the MACD line. The histogram is the graphical representation of the difference between these two lines. Interpreting MACD values involves understanding the significance of the MACD line, signal line, and histogram, along with their respective crossovers. When the MACD line crosses above the signal line, it generates a bullish signal. When it crosses below, it produces a bearish signal. Additionally, the MACD histogram can provide early indications of upcoming crossovers and potential buy and sell opportunities. MACD is commonly used to identify market trends and potential reversals. The principle is that when the MACD line crosses above the signal line, it's a bullish trend, and when it crosses below, it's a bearish trend. Also, the distance between the MACD line and the signal line can signal the strength of the trend – the wider the gap, the stronger the trend. In bullish markets, traders look for instances where the MACD line crosses above the signal line, often taking this as a signal to enter long positions. On the other hand, in bearish markets, when the MACD line crosses below the signal line, it may suggest an opportunity to open a short position. These are crucial concepts in MACD analysis. A bullish divergence occurs when the price records a lower low, but the MACD forms a higher low, suggesting a potential reversal to the upside. Conversely, a bearish divergence happens when the price registers a higher high while the MACD plots a lower high, indicating a possible downward reversal. Convergence, on the other hand, refers to the scenario where the MACD line and the signal line move closer together, indicating a potential slowdown in the current trend. Momentum in trading refers to the rate of acceleration of a security's price or volume. Essentially, it compares where the current price is in relation to where it was in the past. As a momentum indicator, the MACD can provide insights into the strength of a price move. The MACD histogram is a visual representation of the difference between the MACD and the signal line. It oscillates above and below a zero line. Positive values indicate bullish momentum, while negative values suggest bearish momentum. The higher or lower the histogram bars, the stronger the momentum. While not typically its primary use, MACD can also be used to identify overbought and oversold conditions. When the MACD line and histogram dramatically rise or fall, it may suggest overbought (for ascents) or oversold (for descents) conditions, indicating potential reversals. The MACD crossover strategy is straightforward: when the MACD line crosses above the signal line, go long (buy). Conversely, when the MACD line crosses below the signal line, go short (sell). This strategy works well in trending markets but can produce false signals during choppy or sideways markets. The MACD divergence strategy involves looking for discrepancies between the price action and the MACD line. A bullish divergence could be a lower low in price but a higher low in MACD, suggesting buying pressure. On the other hand, a bearish divergence could be a higher high in price but a lower high in MACD, suggesting selling pressure. The MACD histogram strategy uses the histogram and its interaction with the zero line. A bullish signal occurs when the histogram moves from below to above the zero line, and a bearish signal happens when it moves from above to below the zero line. Traders also watch for divergences on the histogram for additional trading signals. MACD is easy to understand and use, making it suitable for both beginners and experienced traders. Its signals are straightforward and visually intuitive. MACD is versatile across different markets (stocks, forex, cryptocurrencies) and different timeframes, making it a popular choice among traders of all types. MACD combines elements of both trend and momentum indicators, providing a comprehensive view of the market. This allows traders to identify potential buy/sell points and gauge the strength of the ongoing trend. MACD can provide clear entry and exit points, helping traders manage their trades more effectively and potentially increase profitability. As a trend-following indicator, MACD is a lagging indicator. This means it tends to react to price changes rather than predict them, potentially leading to delayed entry and exit points. MACD can produce false signals during choppy or sideways markets when price action is volatile and trends are less established. While MACD can provide valuable insights, it's often recommended to use it in combination with other indicators or technical analysis tools for confirmation to increase the chances of successful trades. As with any technical indicator, there's a risk of over-optimization with MACD. Traders may be tempted to fine-tune the settings to fit the historical data, which may not yield successful results in live trading. MACD is extensively used in forex markets due to its effectiveness in identifying trends and momentum. Forex traders often use MACD crossovers, divergences, and rapid rises/falls as signals for entering or exiting trades. In the highly volatile cryptocurrency markets, MACD is a valuable tool for identifying potential buy and sell points. Cryptocurrency traders particularly appreciate its ability to detect trend changes early. In stock markets, MACD can help traders and investors identify potential reversals and the strength of trends, aiding in decision-making for both short-term trades and long-term investments. Both MACD and RSI are momentum indicators, but they work differently. While MACD is a trend-following indicator, RSI is an oscillator that measures speed and change of price movements. RSI ranges from 0 to 100 and is often used to identify overbought and oversold conditions. Bollinger Bands are a volatility indicator that consists of a middle band with two outer bands. The distance between the bands indicates market volatility. Unlike MACD, which provides trend and momentum signals, Bollinger Bands primarily provide price levels at which a security may be overbought or oversold. The Stochastic Oscillator is a momentum indicator that shows the location of the close relative to the high-low range over a set number of periods. While MACD is useful in identifying the direction and strength of a trend, the Stochastic Oscillator is more commonly used to identify overbought and oversold conditions. The Moving Average Convergence Divergence is a powerful and versatile technical indicator that offers valuable insights into market trends, momentum, and potential buy and sell signals. Its simplicity and visual intuitiveness make it accessible to both novice and experienced traders. MACD's ability to function across different markets and timeframes further enhances its value, making it a popular choice among traders of various types. By combining trend-following elements with momentum analysis, MACD provides a comprehensive view of the market, enabling traders to make informed decisions about entry and exit points. However, it's important to note that MACD has limitations, such as being a lagging indicator and producing false signals during choppy markets. Therefore, it is recommended to use MACD in conjunction with other indicators or technical analysis tools for additional confirmation and to avoid over-optimization.What Is the Moving Average Convergence Divergence (MACD)?
How MACD Works
Components of MACD
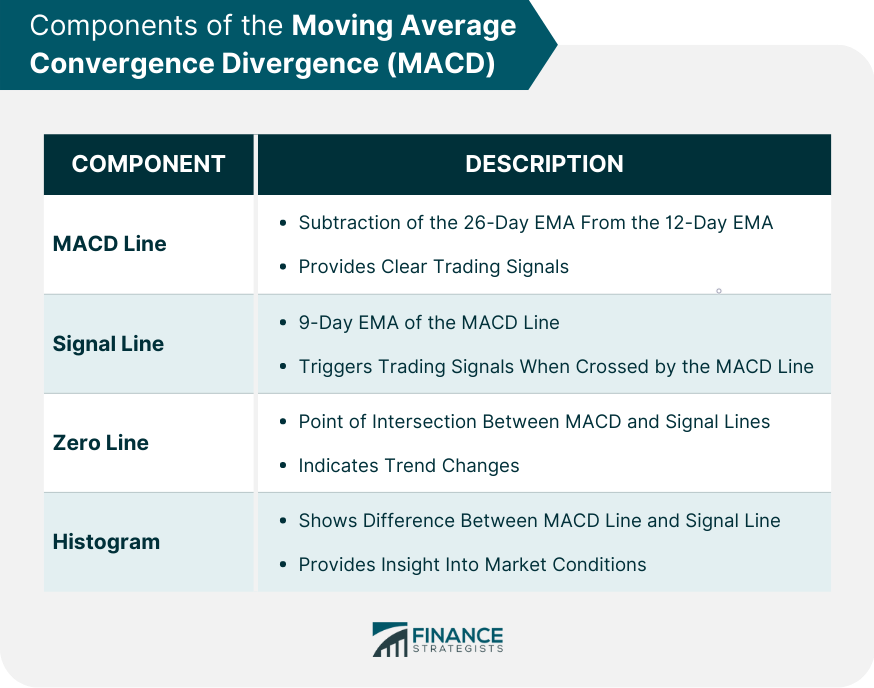
MACD Line
Signal Line
Zero Line
Histogram
Mathematics Behind MACD
Interpreting MACD Values
MACD as a Trend-Following Indicator
Identifying Market Trends
Use of MACD in Bullish and Bearish Markets
Divergence and Convergence
MACD as a Momentum Indicator
Understanding Momentum in Trading
Interpretation of MACD Histogram
MACD for Identifying Overbought and Oversold Conditions
MACD Trading Strategies
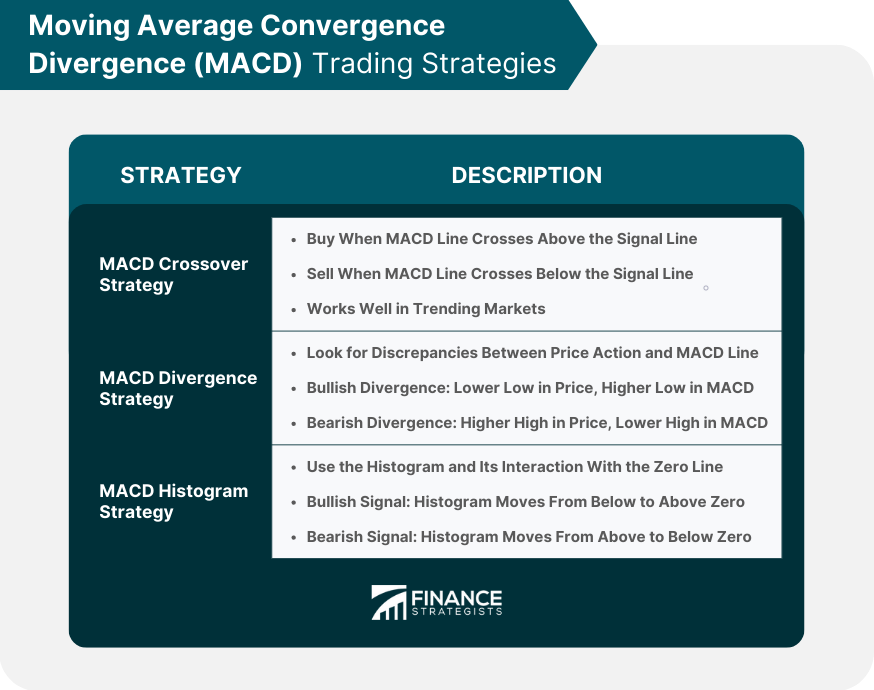
MACD Crossover Strategy
MACD Divergence Strategy
MACD Histogram Strategy
Benefits of Using MACD in Trading
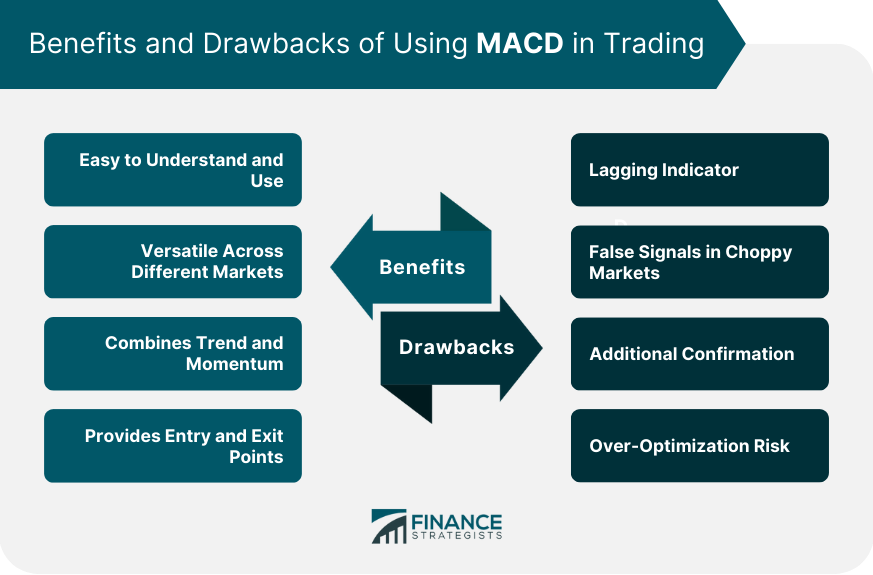
Easy to Understand and Use
Versatile Across Different Markets
Combines Trend and Momentum
Provides Entry and Exit Points
Drawbacks of Using MACD in Trading
Lagging Indicator
False Signals in Choppy Markets
Additional Confirmation
Over-Optimization Risk
MACD in Different Market Conditions
Forex
Cryptocurrency
Stock Markets
Comparing MACD With Other Technical Indicators
MACD vs Relative Strength Index (RSI)
MACD vs Bollinger Bands
MACD vs Stochastic Oscillator
Final Thoughts
Moving Average Convergence Divergence (MACD) FAQs
The MACD is calculated by subtracting the 26-day Exponential Moving Average (EMA) from the 12-day EMA of a security's price. The result is the MACD line. Additionally, a 9-day EMA of the MACD line, called the "signal line," is plotted on top of the MACD line.
A MACD crossover occurs when the MACD line crosses above or below the signal line. A crossover above the signal line generates a bullish signal, suggesting a potential buying opportunity. Conversely, a crossover below the signal line produces a bearish signal, indicating a possible selling opportunity.
Yes, MACD can be used to identify potential trend reversals. A bullish divergence occurs when the price records a lower low, but the MACD forms a higher low, indicating a potential upward reversal. Similarly, a bearish divergence happens when the price registers a higher high while the MACD plots a lower high, suggesting a possible downward reversal.
Yes, MACD is a valuable tool in volatile markets like cryptocurrencies. It can help identify potential buy and sell points, detect trend changes early, and provide insights into market momentum. Traders in cryptocurrency markets often rely on MACD to make informed trading decisions.
MACD works best in trending markets where price movements are more consistent and established. It may produce false signals in choppy or sideways markets where price action is volatile and lacks a clear trend. Traders should exercise caution and consider using additional indicators or analysis techniques to confirm signals in such market conditions.
True Tamplin is a published author, public speaker, CEO of UpDigital, and founder of Finance Strategists.
True is a Certified Educator in Personal Finance (CEPF®), author of The Handy Financial Ratios Guide, a member of the Society for Advancing Business Editing and Writing, contributes to his financial education site, Finance Strategists, and has spoken to various financial communities such as the CFA Institute, as well as university students like his Alma mater, Biola University, where he received a bachelor of science in business and data analytics.
To learn more about True, visit his personal website or view his author profiles on Amazon, Nasdaq and Forbes.


