
Standard deviation is a statistical measure that quantifies the dispersion or variability of a set of data points. In finance, it is often used to assess the volatility of an asset or a portfolio of assets. Standard deviation is crucial in financial analysis as it provides insights into the level of risk associated with various investments. A higher standard deviation indicates higher volatility and potentially higher risk, while a lower standard deviation suggests more stability and lower risk. Standard deviation is one of several measures of dispersion used in finance. Other measures include range, interquartile range, mean absolute deviation, and variance. Each measure provides unique insights into the distribution and variability of financial data. Population standard deviation is calculated when the entire population of data points is considered. It measures the dispersion of data points around the population mean, providing a comprehensive assessment of variability in the population. Sample standard deviation is calculated when a sample of data points is considered rather than the entire population. It estimates the dispersion of data points around the sample mean, which is used as an approximation of the population standard deviation. Variance is a measure of dispersion that calculates the average squared difference between each data point and the mean. Standard deviation is the square root of the variance, making it more interpretable and easier to compare with the original data. Standard deviation is used in portfolio risk management to assess the risk associated with individual assets. Assets with higher standard deviations are considered riskier, as they exhibit higher price fluctuations and potential losses. Diversification strategies aim to reduce portfolio risk by investing in assets with varying degrees of standard deviation. By combining assets with different standard deviations, investors can create a more stable and less volatile portfolio. Standard deviation is used to evaluate investment performance by calculating risk-adjusted returns. This allows investors to compare the performance of different investments, taking into account both the returns and the associated risks. Investors can use standard deviation to compare the risk profiles of various investments. By examining the standard deviations of different assets, investors can make more informed decisions about which investments are most suitable for their risk tolerance. Standard deviation is used in financial modeling and forecasting to model the volatility of assets, which is essential for pricing financial instruments, such as options, and assessing market risk. Value at Risk (VaR) is a risk measure that estimates the maximum potential loss of a portfolio over a specified time horizon and confidence level. Standard deviation is used in VaR calculations to quantify the portfolio's risk and predict potential losses. Normal distribution, also known as the Gaussian distribution, is a probability distribution commonly used in finance to model asset returns. It is characterized by a bell-shaped curve, with the mean, median, and mode being equal, and standard deviation determining the width of the curve. The empirical rule, also known as the 68-95-99.7 rule, states that in a normal distribution, approximately 68% of the data points lie within one standard deviation of the mean, 95% within two standard deviations, and 99.7% within three standard deviations. This rule is often used to estimate the probability of specific outcomes in finance. While normal distribution is widely used in finance, it has limitations. One significant limitation is the assumption that asset returns are symmetric and independent, which may not always hold true in real-world financial markets. This can lead to an underestimation of extreme events and potential risks. Mean absolute deviation is an alternative measure of dispersion that calculates the average absolute difference between each data point and the mean. MAD is less sensitive to extreme values compared to standard deviation, making it a useful alternative for assessing risk in finance. Semi-standard deviation is a measure of dispersion that considers only the downside deviations from the mean. It is useful for investors who are more concerned about potential losses and downside risk, as it focuses on the negative fluctuations in asset returns. Downside risk measures, such as Sortino ratio and downside deviation, specifically assess the risk of negative returns. These measures provide a more focused assessment of investment risk by considering the downside potential, which is particularly relevant for risk-averse investors. Standard deviation is a crucial measure of dispersion in finance, offering insights into the risk and volatility associated with various investments. Understanding its calculation, applications, and relationship with normal distribution is essential for making informed investment decisions. Grasping the concept of standard deviation is vital for financial analysts and investors, as it helps evaluate investment performance, manage portfolio risk, and model financial forecasts more effectively. Future research in standard deviation in finance may focus on developing new measures of dispersion, improving financial modeling techniques, and exploring the limitations and assumptions of existing risk measures. Given the importance of understanding standard deviation in finance, seeking professional wealth management services is essential. What Is Standard Deviation?
Calculation of Standard Deviation
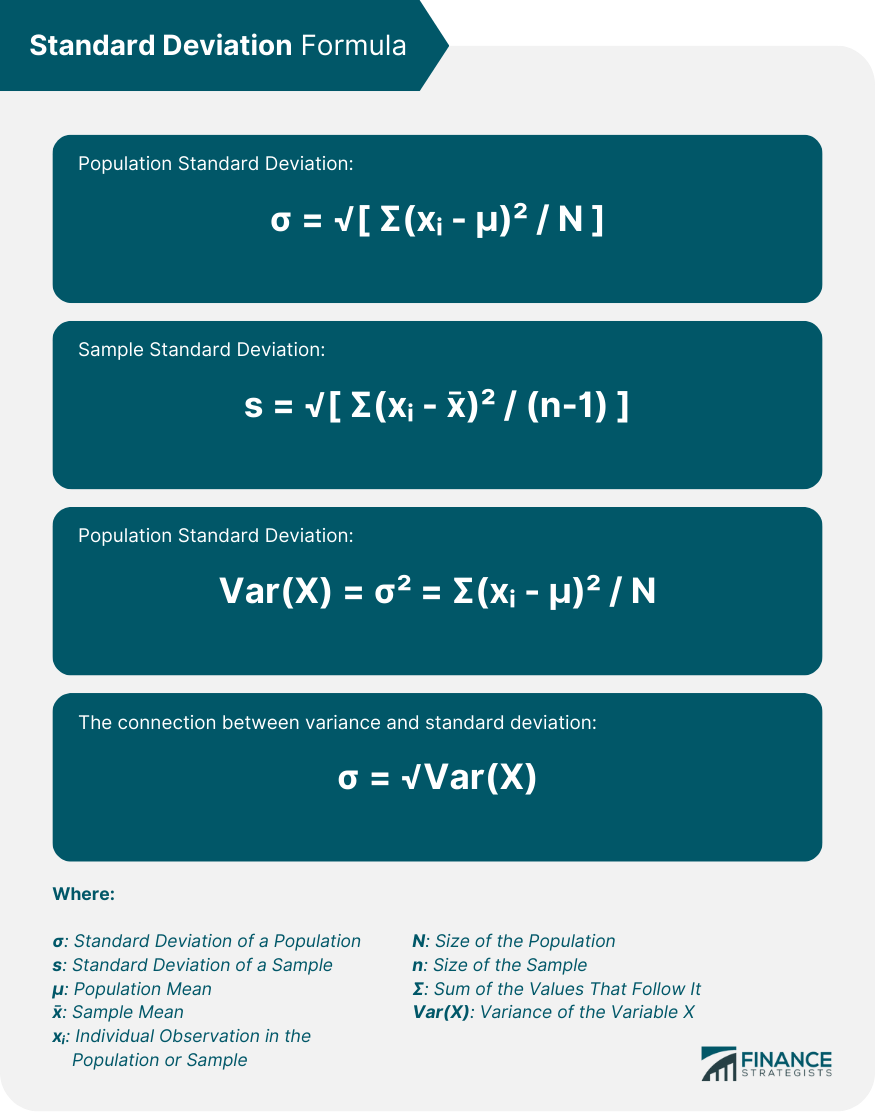
Population Standard Deviation
Sample Standard Deviation
Variance and Its Connection to Standard Deviation
Applications of Standard Deviation in Finance
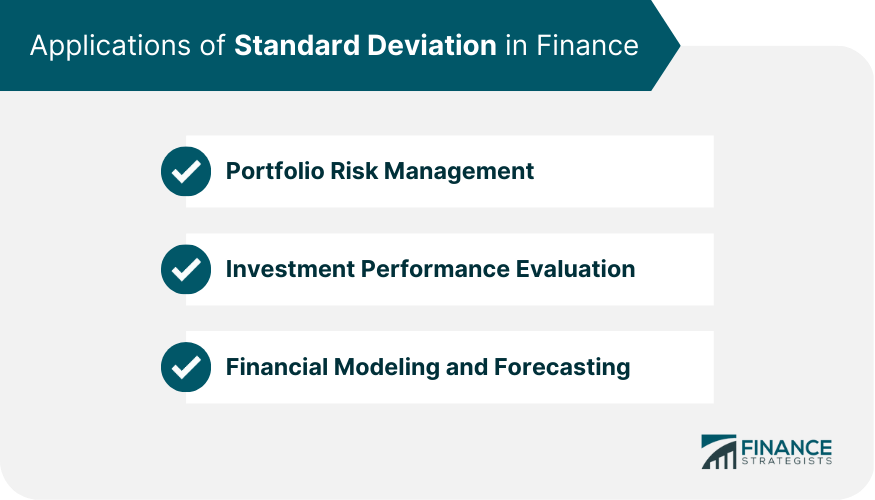
Portfolio Risk Management
Assessing Individual Asset Risk
Diversification Strategies
Investment Performance Evaluation
Risk-Adjusted Returns
Comparing Investments
Financial Modeling and Forecasting
Volatility Modeling
Value at Risk (VaR) Calculations
Standard Deviation and Normal Distribution
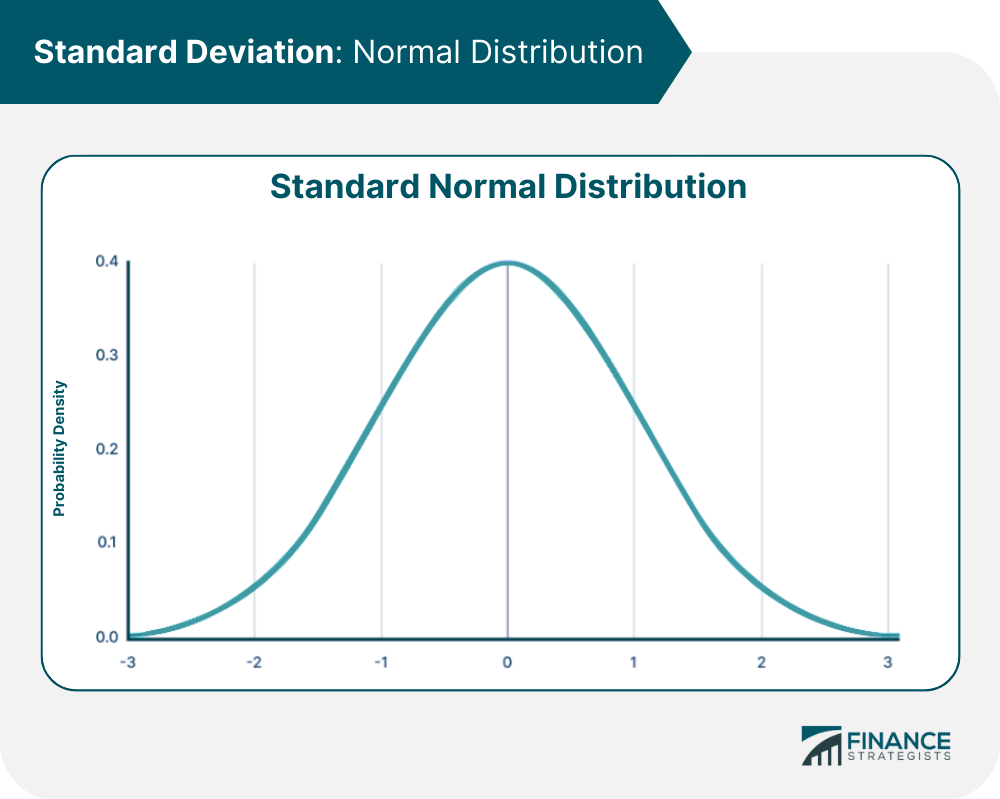
Normal Distribution in Finance
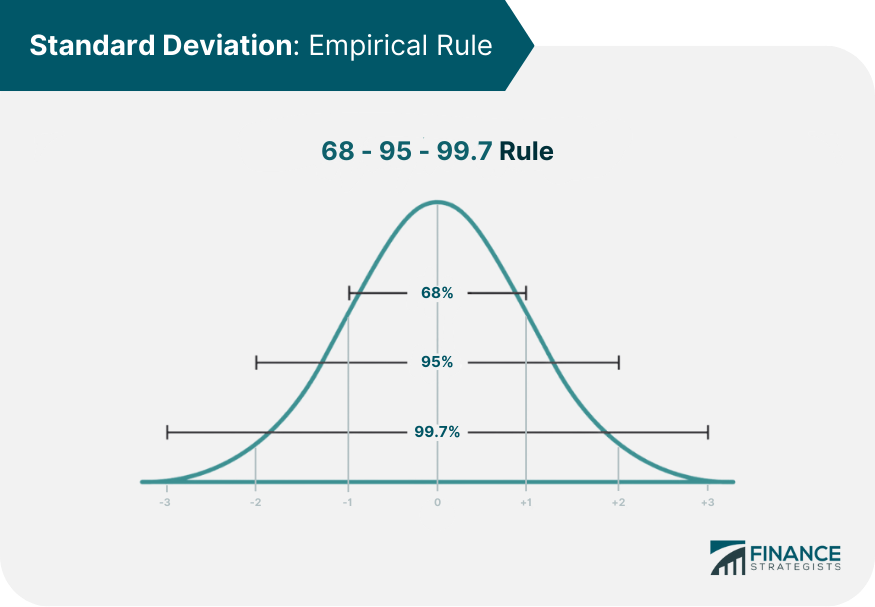
Standard Deviation and the Empirical Rule
Limitations of Normal Distribution Assumptions
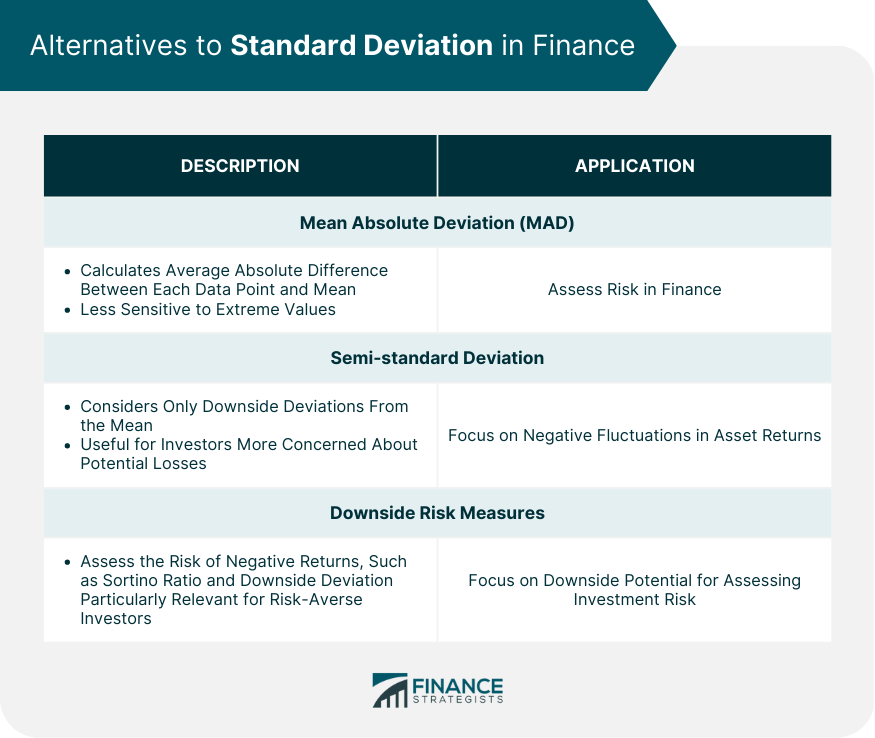
Alternatives to Standard Deviation in Finance
Mean Absolute Deviation (MAD)
Semi-Standard Deviation
Downside Risk Measures
Final Thoughts
Standard Deviation FAQs
Standard deviation is a statistical measure that quantifies the dispersion or variability of a set of data points. In finance, it is often used to assess the volatility of an asset or a portfolio of assets.
Standard deviation is calculated by finding the square root of the variance. Variance is the average squared difference between each data point and the mean.
Standard deviation is used in portfolio risk management, assessing individual asset risk, diversification strategies, investment performance evaluation, financial modeling and forecasting, and the use of normal distribution in finance.
One significant limitation of normal distribution assumptions is the assumption that asset returns are symmetric and independent, which may not always hold true in real-world financial markets. This can lead to an underestimation of extreme events and potential risks.
Alternatives to standard deviation in finance include mean absolute deviation (MAD), semi-standard deviation, and downside risk measures such as Sortino ratio and downside deviation. These measures provide a more focused assessment of investment risk by considering the downside potential, which is particularly relevant for risk-averse investors.
True Tamplin is a published author, public speaker, CEO of UpDigital, and founder of Finance Strategists.
True is a Certified Educator in Personal Finance (CEPF®), author of The Handy Financial Ratios Guide, a member of the Society for Advancing Business Editing and Writing, contributes to his financial education site, Finance Strategists, and has spoken to various financial communities such as the CFA Institute, as well as university students like his Alma mater, Biola University, where he received a bachelor of science in business and data analytics.
To learn more about True, visit his personal website or view his author profiles on Amazon, Nasdaq and Forbes.


