
Overbought is a term used in technical analysis to describe a situation when a security or a market segment has been subject to significant buying pressures, driving prices to levels considered higher than their intrinsic value or historical averages. In other words, an overbought market condition is when prices surge quickly to the point that they become expensive and are due for a pullback or a downward correction. Identifying overbought conditions can provide valuable insight into potential future market movements. An overbought condition can be an indication that a security's price is at a peak and may soon fall. It helps in optimizing buying and selling decisions. There's a common misconception that overbought automatically equates to a "sell" signal. While it's true that overbought conditions can precede price drops, it doesn't always lead to immediate reversals. Sometimes, a security can remain overbought for an extended period, particularly during a strong uptrend. It's essential to view overbought conditions as an alert of a potential price change and not an immediate call to action. The RSI is a momentum oscillator that measures the speed and change of price movements. It's calculated using the ratio of higher closes to lower closes over a specified period, typically 14 periods. The resulting number is then indexed to a value between 0 and 100. Generally, an RSI value above 70 indicates that a security is becoming overbought and may be primed for a price pullback. Conversely, an RSI below 30 suggests that a security is oversold and might be ready for a price bounce. Bollinger Bands are a volatility indicator consisting of a simple moving average (middle band) and two standard deviation lines above and below it (upper and lower bands). These bands expand and contract based on market volatility. When a stock's price touches or moves above the upper band, it's considered overbought, signaling a potential price drop. However, like with RSI, the Bollinger Bands should be used with other indicators for confirmation. The Stochastic Oscillator is another momentum indicator. It compares a security's closing price to its price range over a specific period. The Stochastic Oscillator uses a scale of 0 to 100. A value above 80 often indicates an overbought condition, suggesting the possibility of a price decline. Overbought conditions can be a warning signal for traders and investors. It suggests that a security is trading at a price higher than its intrinsic value and may be due for a pullback. However, it's important to remember that a stock can remain overbought for an extended period, particularly in a strong bull market. Timing market entry and exit points is a challenge that every trader faces. When a security is in an overbought condition, it might be a good time for traders to consider taking profits and for potential buyers to wait for the price to pull back. However, traders should be cautious and seek confirmation from other indicators or news events before making a decision. When trading in overbought conditions, risk management becomes increasingly important. Setting stop-loss orders can help limit potential losses in case the price continues to rise despite overbought conditions. It's also essential to avoid buying stocks solely because they're overbought, as this could result in buying at a peak. While overbought refers to a condition where prices have risen significantly and may be due for a pullback, oversold is the opposite. An oversold condition occurs when a security has been heavily sold, driving prices down to levels that may be lower than their intrinsic value. Despite this contrast, both conditions represent points in the market cycle where prices are expected to reverse. Recognizing overbought and oversold conditions can help traders understand where a security might be in its market cycle. For instance, prolonged overbought conditions might indicate that a security is nearing the peak of its cycle and could be due for a decline. Monitoring overbought and oversold conditions can also aid in balancing and managing a portfolio. For example, in an overbought market, investors might consider taking profits on some positions or looking for opportunities in other, less overbought market segments. Short selling involves borrowing shares of a stock and selling them in the open market with the expectation that the price will decline. Once the price drops, the short seller buys back the shares at a lower price, returns them to the lender, and pockets the difference. However, this strategy carries significant risks, as potential losses can be infinite if the stock price rises instead of falls. In overbought conditions, some traders might choose to go short, betting that the price will drop. But it's important to consider the risks and ensure there are strong reasons for believing a price decline is imminent, such as bearish signals from other technical indicators or negative news events. A put option gives the holder the right, but not the obligation, to sell a specified amount of an underlying security at a specified price within a specified timeframe. It's a bet that the security's price will decline. Put options can be a way to profit from overbought conditions. If a trader believes a stock's price is about to decline, they can buy a put option. If the price does drop, they can either sell the put for a profit or exercise the option and sell the stock at the strike price. The effectiveness of overbought indicators can vary depending on overall market conditions. For example, in a strong bull market, securities can remain overbought for longer periods, leading to false sell signals. Overbought indicators can sometimes give false signals, suggesting a price reversal that never materializes. This is why it's crucial to use these indicators in conjunction with other tools and to consider the overall market context. While overbought indicators can provide useful signals, they should be used as part of a broader analysis. Fundamental analysis, including evaluation of a company's earnings, valuation, and industry position, should also play a role in decision-making. Understanding the broader market sentiment and macroeconomic factors can also be beneficial. Overbought conditions serve as warning signals for traders and investors, indicating that a security or market segment may be trading at a price higher than its intrinsic value and due for a pullback. Common indicators of overbought include RSI, Bollinger Bands, and Stochastic Oscillator. It is important to understand the implications of overbought conditions. Timing market entry and exit points become crucial. Risk management, including setting stop-loss orders, is essential in overbought conditions to limit potential losses. Balancing portfolios by monitoring overbought and oversold conditions can aid in optimizing investment strategies and identifying opportunities in less overbought market segments. While strategies such as short selling and options trading can be employed during overbought conditions, they come with their own risks and require strong reasoning supported by bearish signals from other technical indicators or negative news events. It's important to recognize the limitations of relying solely on overbought indicators, as their effectiveness can be influenced by overall market conditions, and false signals can occur. Therefore, it is advisable to incorporate supplementary analysis, such as fundamental analysis and consideration of broader market sentiment and macroeconomic factors, to make well-informed investment decisions.What Is Overbought?
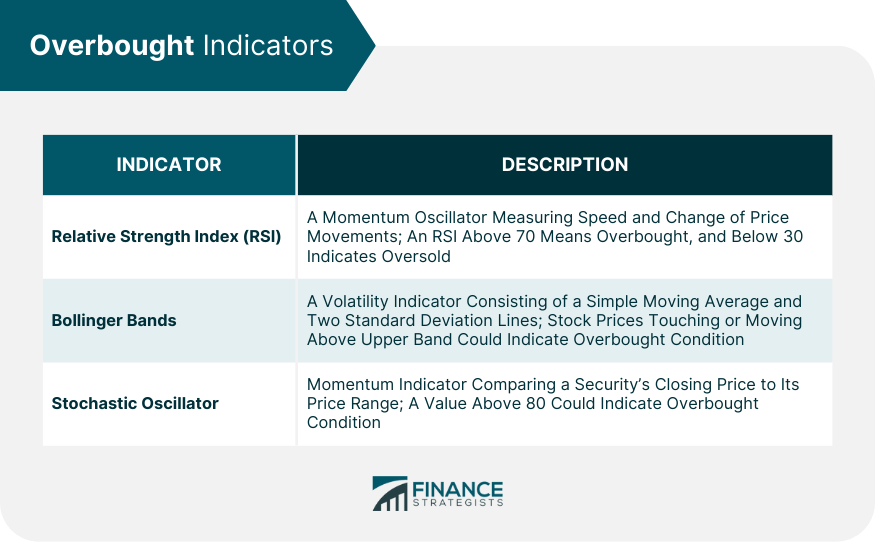
Overbought Indicators
Relative Strength Index (RSI)
Bollinger Bands
Stochastic Oscillator
Analyzing Overbought Conditions
Understanding the Implications
Timing of Market Entry and Exit
Risk Management Considerations
Overbought vs Oversold
Key Differences and Similarities
Market Cycle Understanding
Importance in Balancing Portfolio
Strategies for Trading Overbought Stocks
Short Selling
Options Trading
Limitations of Relying on Overbought Indicators
Dependence on Market Conditions
Issues With False Signals
Need of Supplementary Analysis
Final Thoughts
Overbought FAQs
When a security is overbought, it means that it has experienced significant buying pressures, causing its price to rise to levels higher than its intrinsic value or historical averages. This condition suggests that the security may be due for a pullback or downward correction.
Yes, it is possible for a security to remain overbought for an extended period, particularly during a strong uptrend. Overbought conditions should be viewed as an alert of a potential price change rather than an immediate call to action. It's important to consider other indicators and market factors before making trading decisions.
No, overbought conditions do not always indicate a sell signal. While they can precede price drops, securities can remain overbought for a while before a reversal occurs. Overbought conditions should be used as a warning signal, and traders should seek confirmation from other indicators or news events before deciding to sell.
Overbought indicators, such as the Relative Strength Index (RSI), Bollinger Bands, and Stochastic Oscillator, can be used to identify potential overbought conditions. Traders can use these indicators as part of their analysis to determine if a security is reaching a point of potential price decline. However, it's important to use these indicators in conjunction with other tools and conduct a comprehensive analysis before making trading decisions.
In overbought conditions, risk management becomes crucial. Traders can consider implementing stop-loss orders to limit potential losses if the price continues to rise despite overbought conditions. It's also important to avoid buying stocks solely based on overbought conditions, as this could lead to buying at a peak. Proper risk assessment and portfolio diversification are essential elements of effective risk management in overbought conditions.
True Tamplin is a published author, public speaker, CEO of UpDigital, and founder of Finance Strategists.
True is a Certified Educator in Personal Finance (CEPF®), author of The Handy Financial Ratios Guide, a member of the Society for Advancing Business Editing and Writing, contributes to his financial education site, Finance Strategists, and has spoken to various financial communities such as the CFA Institute, as well as university students like his Alma mater, Biola University, where he received a bachelor of science in business and data analytics.
To learn more about True, visit his personal website or view his author profiles on Amazon, Nasdaq and Forbes.


