
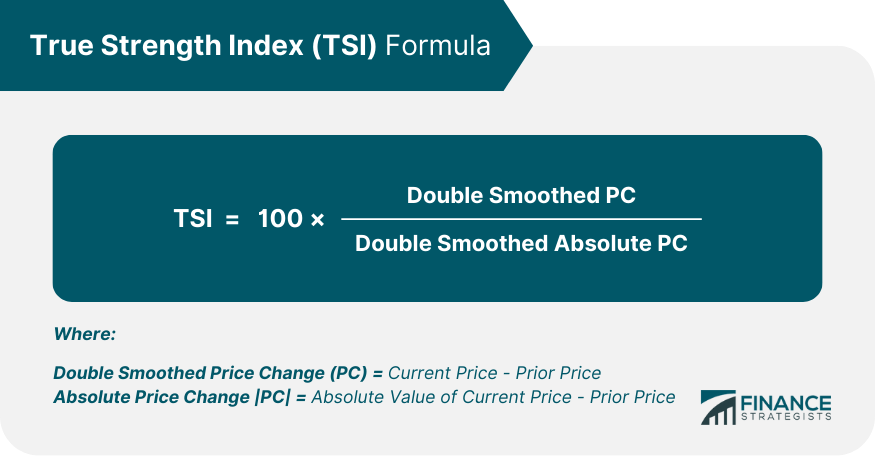
The True Strength Index (TSI) is a momentum oscillator developed by William Blau, primarily used to identify overbought and oversold conditions in an asset's price. It's designed to provide more accurate and less volatile signals of price momentum by applying a double smoothing technique to the rate of change in prices. The TSI values range from +100 to -100, with positive values indicating bullish (upward) momentum and negative values indicating bearish (downward) momentum. It can be used to generate trading signals and can aid in confirming trends and spotting potential trend reversals. Traditionally, values above +25 signal a possible bullish trend, whereas values below -25 may indicate a bearish trend, but traders often use their own specific thresholds based on their unique risk tolerance and trading strategy. At the heart of the TSI is the concept of price momentum. Simply put, momentum is the speed at which the price of an asset changes over a specific period. This concept underpins the TSI by highlighting periods where the momentum of price change is either strengthening or weakening. The unique aspect of TSI lies in its double smoothing technique. This technique involves two steps: first, the calculation of a short-term momentum and then smoothing it with a longer-term average. The result is a less erratic and more accurate representation of an asset's price momentum. The True Strength Index is calculated using a specific formula: Let's say the current price of a stock is $100 and the prior price is $95. The price change (PC) would be 5. The first smoothing step would use a 25-period EMA of PC, which would give a value of 3. The second smoothing step would use a 13-period EMA of the 25-period EMA of PC, which would give a value of 2. The absolute price change (|PC|) would be calculated as the absolute value of the price change (PC), which is 5. The first smoothing step would use a 25-period EMA of |PC|, which would give a value of 4. The second smoothing step would use a 13-period EMA of the 25-period EMA of |PC|, which would give a value of 3. The TSI would then be calculated as 100 x Double Smoothed PCDouble Smoothed Absolute PC, which would give a value of 66.67. In this example, the TSI is reading at 66.67, which is above the overbought threshold of 70. This indicates that the market is overbought and may be due for a correction. It is important to note that the TSI is a momentum indicator and does not take into account other factors, such as volume or sentiment. As such, it should not be used as the sole basis for making trading decisions. TSI values range from +100 to -100, where positive values indicate bullish (upward) momentum, and negative values indicate bearish (downward) momentum. A TSI value at +25, for instance, suggests stronger bullish momentum than a value at +10. Zero line crossovers are key events in the TSI. When the TSI crosses above the zero line, it signals increased bullish momentum, whereas a cross below the zero line indicates increasing bearish momentum. Divergences between price and TSI values can signal potential reversals. A bullish divergence occurs when prices reach new lows while the TSI makes higher lows. Conversely, a bearish divergence happens when prices reach new highs while the TSI makes lower highs. TSI generates trading signals based on the principles of overbought and oversold conditions, zero line crossovers, and divergence. For example, when TSI reaches extreme positive values (typically above +25), it may indicate overbought conditions, suggesting that the asset may be poised for a price decrease. Overbought and oversold conditions are pivotal for traders. When the TSI value is above +25, the market may be overbought, indicating a potential sell signal. Conversely, a TSI value below -25 suggests oversold conditions, hinting at a potential buying opportunity. Divergences can serve as strong signals for trend reversals. A bullish divergence, characterized by lower lows in price and higher lows in the TSI, signals a potential upward reversal. Conversely, a bearish divergence, characterized by higher highs in price and lower highs in the TSI, suggests a potential downward reversal. TSI can be used to confirm trends by comparing its values with the prevailing price trend. For instance, during an uptrend, the TSI should generally remain positive, reinforcing the strength of the upward price movement. While both TSI and RSI are momentum indicators, they differ significantly. The RSI measures the speed and change of price movements on a scale of 0-100. At the same time, the TSI applies a double smoothing technique, providing a less volatile and arguably more accurate momentum signal. MACD is another widely used momentum indicator that measures the relationship between two moving averages of a security's price. Although both MACD and TSI provide signals for trend and momentum, TSI's double smoothing technique offers a less noisy momentum signal, making it arguably superior in certain market conditions. The Stochastic Oscillator is a momentum indicator that compares a particular closing price of a security to a range of its prices over a certain period. Despite similarities, TSI provides a smoother momentum line due to its double smoothing technique, potentially reducing the number of false signals. Despite its strengths, TSI can occasionally produce false signals. Like any other technical indicator, TSI's signals should always be confirmed with other technical analysis tools to increase the accuracy of predictions. TSI, being a momentum oscillator, inherently lags actual price movements. This is because it's based on historical price data. As such, signals may sometimes be late, potentially leading to missed opportunities. Due to the potential for false signals and its lagging nature, TSI should not be used in isolation. It is more effective when used in combination with other indicators or tools that can confirm its signals, such as trend lines, support and resistance levels, or other momentum oscillators. TSI can be paired with other technical indicators to enhance trading strategies. For instance, pairing TSI with a Simple Moving Average (SMA) could help confirm trend direction, while combining it with the MACD could provide additional confirmation of momentum shifts. Understanding how to apply the TSI in various market conditions is crucial. In trending markets, for example, the TSI could be used to identify potential entry and exit points. In contrast, in ranging markets, it could be used to identify potential reversals at overbought and oversold levels. Even with a comprehensive understanding of the TSI, traders should always prioritize risk management. This involves setting stop losses to limit potential losses and only risking a small portion of the trading capital on any single trade. In the modern era of algorithmic trading, the TSI can be utilized within trading algorithms to generate buy and sell signals automatically. Its robustness and accuracy make it a popular choice among algorithmic traders. TSI can also be applied in sector analysis to identify sectors with strong momentum. This can be particularly useful for portfolio managers and investors looking to rotate into sectors demonstrating strong momentum. By identifying overbought and oversold conditions in various assets, TSI can help rebalance a portfolio. It can provide indications of when to potentially reduce holdings in overbought assets and increase holdings in oversold assets. The True Strength Index is a valuable momentum oscillator that aids in identifying overbought and oversold conditions, generating trading signals, confirming trends, and pinpointing potential trend reversals. Notable for its unique double smoothing technique, TSI provides a less erratic and more accurate momentum signal, making it advantageous compared to other momentum oscillators like RSI, MACD, and Stochastic Oscillator. Despite its usefulness, TSI does have limitations, including the potential for false signals and its inherently lagging nature. Therefore, it's recommended to use TSI in conjunction with other technical analysis tools for increased accuracy. Understanding its application across different market conditions and incorporating risk management when using TSI is crucial. Advanced uses extend to algorithmic trading, sector analysis, and portfolio management, where TSI's ability to detect momentum changes can significantly enhance decision-making processes.Definition of True Strength Index (TSI)
Components of TSI
Price Momentum
Double Smoothing Technique
TSI Formula and Calculation
Understanding TSI Values
Positive and Negative Values
Zero Line Crossovers
Divergence and Convergence
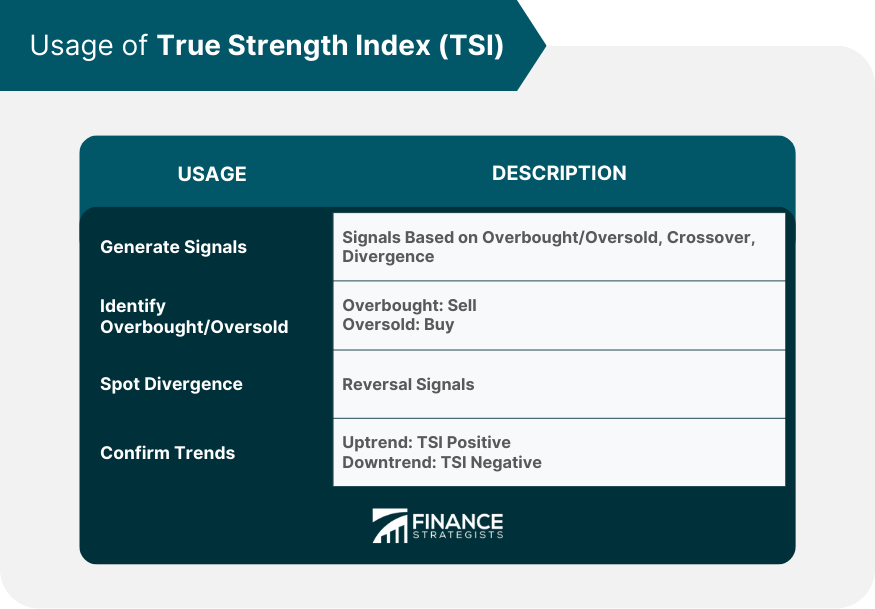
Usage of TSI
Generating Trading Signals
Identifying Overbought and Oversold Conditions
Spotting Bullish and Bearish Divergences
Confirming Trends
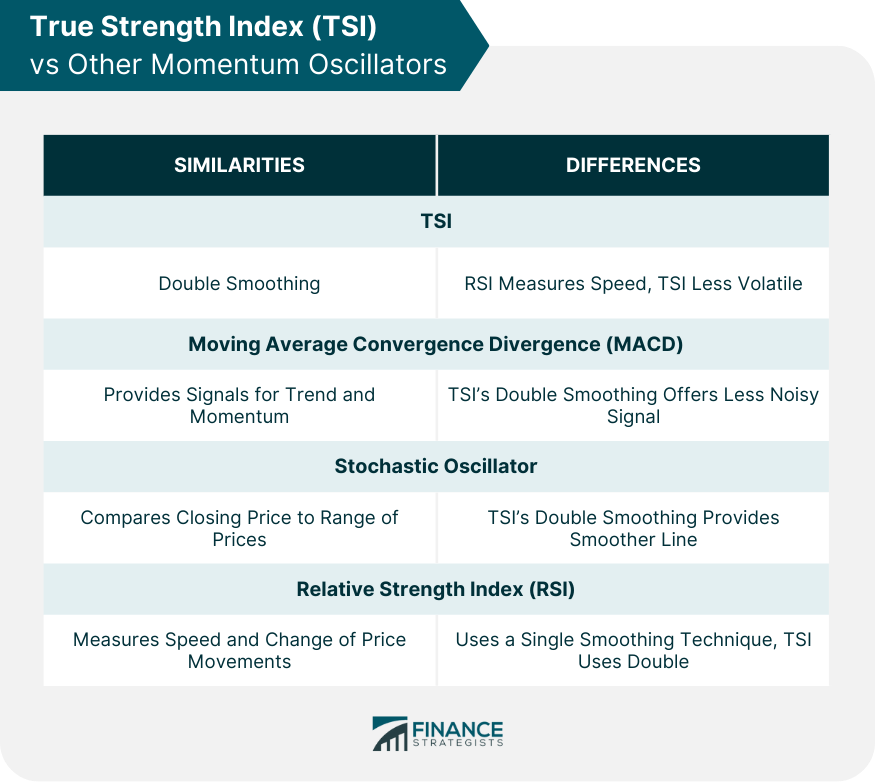
TSI vs Other Momentum Oscillators
Comparison With Relative Strength Index (RSI)
Comparison With Moving Average Convergence Divergence (MACD)
Comparison With Stochastic Oscillator
Limitations of the TSI
False Signals
Lagging Nature
Need for Complementary Tools and Indicators
Incorporating TSI Into Trading Strategy
Combining TSI With Other Indicators
Using TSI in Different Market Conditions
Risk Management When Using TSI
Advanced Applications of TSI
Application in Algorithmic Trading
Use in Sector Analysis
Incorporating TSI in Portfolio Management
Bottom Line
True Strength Index (TSI) FAQs
The True Strength Index (TSI) is a momentum oscillator used primarily to identify overbought and oversold conditions in a financial asset's price. It employs a unique double smoothing technique that makes its price momentum signals less volatile and more accurate.
The True Strength Index is calculated through a specific formula. It first calculates the 13-day exponential moving average (EMA) of price changes and then takes a 25-day EMA of those results. This process is done for both the price changes and absolute price changes. The TSI is the ratio of these two results multiplied by 100.
The TSI generates trading signals based on its values and their relationship to the zero line. When TSI crosses above the zero line, it indicates increasing bullish momentum, signaling a potential buy. Conversely, a cross below the zero line signals increasing bearish momentum, suggesting a potential sell.
While the TSI, RSI, and MACD all measure momentum, TSI uses a double smoothing technique that reduces volatility and enhances accuracy. This makes the TSI potentially superior in generating clear and precise momentum signals.
Like any technical indicator, the TSI has its limitations. It can occasionally generate false signals, particularly in volatile markets. As a momentum oscillator based on past price data, it can lag behind actual price movements. Therefore, it is recommended to use TSI in conjunction with other technical analysis tools to increase the accuracy of predictions.
True Tamplin is a published author, public speaker, CEO of UpDigital, and founder of Finance Strategists.
True is a Certified Educator in Personal Finance (CEPF®), author of The Handy Financial Ratios Guide, a member of the Society for Advancing Business Editing and Writing, contributes to his financial education site, Finance Strategists, and has spoken to various financial communities such as the CFA Institute, as well as university students like his Alma mater, Biola University, where he received a bachelor of science in business and data analytics.
To learn more about True, visit his personal website or view his author profiles on Amazon, Nasdaq and Forbes.


