
The stochastic oscillator is a momentum indicator that compares a specific closing price of a security to a range of its prices over a certain period. This tool is primarily used by technical analysts to gauge the momentum of assets. The stochastic oscillator is expressed in a percentage format and typically ranges between 0 and 100. A reading of 20 is typically considered the oversold threshold, while a reading of 80 is considered overbought. These thresholds may vary depending on the market conditions and the analyst's discretion. The ability to identify these opportunities and react to them swiftly is often crucial in maximizing returns and minimizing risk. The stochastic oscillator can serve as a powerful tool. It helps in making informed decisions based on the market's momentum and the strength of prevailing trends. The %K line is the main line in the stochastic oscillator, and its calculation forms the backbone of this indicator. The formula for calculating the %K line is straightforward: it takes the difference between the latest closing price and the lowest price over a given period, divides it by the highest price minus the lowest price over the same period, and multiplies by 100. While the calculation is simple, interpreting the result is where the art of technical analysis comes into play. The %K line is used to generate trading signals, identify potential trend reversals, and more. The %D line is a moving average of the %K line. Usually, it is a 3-period simple moving average, but the length can vary based on the analyst's preference. This line acts as a "signal line" for the stochastic oscillator. The %D line smooths out the %K line and reduces the number of false signals. It's also used to identify bullish and bearish divergences, which can signal potential trend reversals. The stochastic oscillator uses the concepts of overbought and oversold levels to help traders identify potential reversal points in the market. An asset is considered overbought when the stochastic oscillator is above 80 and oversold when it's below 20. However, these levels should not be viewed in isolation. Just because an asset is overbought, doesn't mean its price will immediately decrease. Similarly, an oversold asset's price might not immediately rise. These levels serve as alerts for potential reversals but need to be confirmed with other indicators or price action. The stochastic oscillator measures the momentum and strength of a trend. When both the %K and %D lines are moving upward, it indicates strong upward momentum. Conversely, when both lines are moving downward, it suggests strong downward momentum. Moreover, when the lines are flat, it means the market is directionless or in a range-bound state. Identifying the momentum and strength of a trend can help traders make informed decisions about when to enter or exit trades. Bullish and bearish divergences in the stochastic oscillator can signal potential trend reversals. A bullish divergence occurs when the price forms a lower low, but the stochastic oscillator forms a higher low. This divergence may suggest that downward momentum is slowing and a trend reversal to the upside may be imminent. Conversely, a bearish divergence occurs when the price forms a higher high, but the stochastic oscillator forms a lower high. This divergence may indicate that upward momentum is waning and a trend reversal to the downside could be on the horizon. The crossover of the %K line and the %D line is a critical aspect of the stochastic oscillator. A bullish crossover occurs when the %K line crosses above the %D line, which could signal a potential buying opportunity. Conversely, a bearish crossover happens when the %K line crosses below the %D line, signaling a possible selling opportunity. However, crossovers should be used in conjunction with other technical analysis tools or price action to confirm the signals and reduce the likelihood of false positives. One common strategy using the stochastic oscillator involves trading on overbought and oversold signals. When the oscillator moves above the 80 level, it indicates that the asset may be overbought, and a sell signal is generated. Conversely, when the oscillator falls below the 20 level, it suggests that the asset may be oversold, and a buy signal is generated. However, this strategy should be used with caution. While the oscillator may indicate overbought or oversold conditions, it does not necessarily mean a price reversal will occur immediately. It is advisable to use this strategy in conjunction with other indicators or price action confirmation. The stochastic oscillator can be instrumental in confirming trend reversals. As discussed earlier, divergences between the price and the oscillator can indicate potential reversals. When combined with other technical analysis tools, such as trendlines or support and resistance levels, these signals can become even more potent. For instance, if a bearish divergence occurs at a major resistance level, it could provide a strong sell signal. Similarly, a bullish divergence at a major support level could generate a strong buy signal. Divergence-based trading is another strategy that makes use of the stochastic oscillator. As already discussed, a divergence between the price and the oscillator can signal a potential trend reversal. Traders who use this strategy look for instances where the price is making higher highs while the oscillator is making lower highs (bearish divergence) or when the price is making lower lows while the oscillator is making higher lows (bullish divergence). These divergences can be used to initiate trades in the direction of the expected reversal. Like all technical analysis tools, the stochastic oscillator is not infallible. It can and does generate false signals. A false signal is when the oscillator generates a trading signal (such as a buy or sell), but the expected price movement does not occur. Moreover, in choppy or sideways markets, the stochastic oscillator can lead to whipsaws. A whipsaw occurs when a trader enters a position based on a signal from the oscillator, only for the price to reverse direction shortly afterward, resulting in a loss. The stochastic oscillator tends to perform best in trending markets and can be less reliable in volatile or choppy markets. In volatile markets, the price can swing dramatically in a short period, leading the oscillator to generate false signals. In choppy or range-bound markets, the price frequently moves back and forth between overbought and oversold levels, making it difficult to identify reliable trading signals. Traders should always consider the overall market conditions when using the stochastic oscillator. The stochastic oscillator should not be used in isolation. To increase the accuracy of the signals it generates, it should be used in conjunction with other technical analysis tools. For instance, a trader might use trendlines, support and resistance levels, or moving averages to confirm the signals generated by the stochastic oscillator. Using multiple indicators can help filter out false signals and increase the reliability of the trading signals. In stock market analysis, the stochastic oscillator is often used to identify potential reversals in the price of individual stocks. Traders look for overbought and oversold levels, crossovers, and divergences to generate trading signals. For instance, if a stock is in a downtrend, but the stochastic oscillator shows a bullish divergence, it could signal a potential reversal to the upside. Traders might then look for further confirmation from other indicators or price action before initiating a long position. In forex market analysis, the stochastic oscillator is used in a similar way. Forex traders look for overbought and oversold levels, crossovers, and divergences in currency pairs to generate trading signals. For example, if a currency pair is in an uptrend, but the stochastic oscillator shows a bearish divergence, it could signal a potential reversal to the downside. Forex traders might then look for further confirmation from other indicators or price action before initiating a short position. The stochastic oscillator can also be applied in the analysis of the cryptocurrency market. Given the high volatility of cryptocurrencies, the oscillator can provide useful signals about potential reversals or the strength of the current trend. For instance, if a cryptocurrency is in a strong uptrend but the stochastic oscillator is showing a bearish divergence, it might indicate that the uptrend is losing steam and a reversal could be on the horizon. The stochastic oscillator is a technical analysis tool that measures the speed and change of price movements, helping traders make informed decisions about when to enter or exit trades. The oscillator provides a multitude of strategies for wealth management, including overbought and oversold trading, trend reversal confirmation, and divergence-based trading. However, like all indicators, it is not infallible and should be used in conjunction with other technical analysis tools to increase the accuracy of its signals. The stochastic oscillator is particularly crucial in wealth management as it aids in identifying potentially lucrative trading opportunities based on market momentum and trend strength. Understanding how to use and interpret the stochastic oscillator can significantly enhance a trader's or investor's ability to manage their wealth effectively.Definition of Stochastic Oscillator
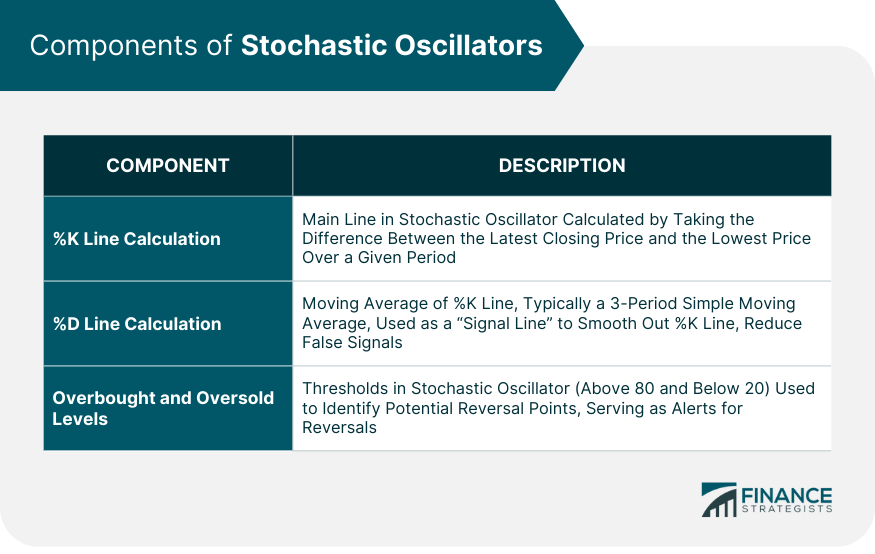
Components of Stochastic Oscillators
%K Line Calculation
%D Line Calculation
Overbought and Oversold Levels
Interpretation of Stochastic Oscillators
Momentum and Trend Strength
Bullish and Bearish Divergences
Crossovers and Signal Line Confirmation
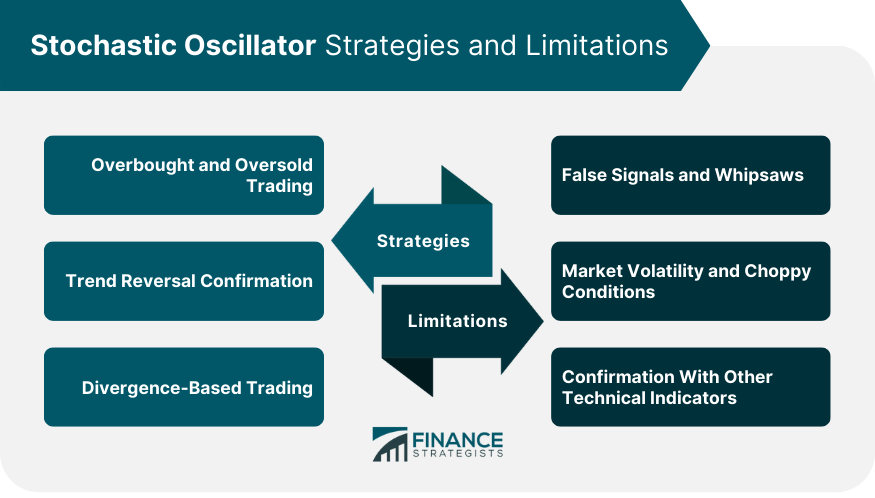
Stochastic Oscillator Strategies in Wealth Management
Overbought and Oversold Trading
Trend Reversal Confirmation
Divergence-Based Trading
Limitations and Considerations in Using Stochastic Oscillators
False Signals and Whipsaws
Market Volatility and Choppy Conditions
Confirmation With Other Technical Indicators
Examples of Stochastic Oscillator Analysis
Stock Market Analysis
Forex Market Analysis
Cryptocurrency Market Analysis
Conclusion
Stochastic Oscillator FAQs
The stochastic oscillator is a momentum indicator that compares a specific closing price of a security to a range of its prices over a certain period. It's used to generate signals for buying and selling opportunities.
The stochastic oscillator is calculated using two lines, the %K line and the %D line. The %K line is calculated by comparing the latest closing price to the high-low range over a specific period. The %D line is a moving average of the %K line.
The stochastic oscillator is interpreted by looking at the position of the %K line relative to the %D line. Bullish and bearish crossovers, overbought and oversold conditions, and divergences between the price and the oscillator can all provide trading signals.
Strategies include trading based on overbought and oversold levels, confirming trend reversals, and divergence-based trading.
Limitations of the stochastic oscillator include the potential for generating false signals, reduced reliability in volatile or choppy markets, and the need for confirmation with other technical indicators.
True Tamplin is a published author, public speaker, CEO of UpDigital, and founder of Finance Strategists.
True is a Certified Educator in Personal Finance (CEPF®), author of The Handy Financial Ratios Guide, a member of the Society for Advancing Business Editing and Writing, contributes to his financial education site, Finance Strategists, and has spoken to various financial communities such as the CFA Institute, as well as university students like his Alma mater, Biola University, where he received a bachelor of science in business and data analytics.
To learn more about True, visit his personal website or view his author profiles on Amazon, Nasdaq and Forbes.


