
Momentum refers to the measure of the speed or velocity of price changes in a financial asset. It encapsulates the concept of a market's strength or weakness, offering insights into the acceleration or deceleration of a trend's movement over time. It is a critical tool to gauge the intensity of a market trend, be it bullish or bearish. By providing an overview of the rate of price changes, momentum indicators allow traders to forecast potential price shifts and make informed trading decisions. These insights can be instrumental in determining entry and exit points, signaling when to buy into a rising market or sell in a falling market. The ability to capture and act upon such changes swiftly can significantly impact the profitability of a trader's activities. Furthermore, momentum indicators can aid in risk management, as they help traders understand market conditions better and adjust their strategies accordingly. Understanding momentum can thus lead to more successful trades, reduced risk, and better overall portfolio performance. At its core, the concept of momentum is based on Newton's first law of motion, which states that an object in motion tends to stay in motion unless acted upon by an external force. Applied to the financial market, this suggests that a stock on an upward or downward trend is likely to continue on that trajectory until a significant external factor triggers a change. This external factor could be anything from macroeconomic events, corporate news, or changes in market sentiment. In trading, momentum is typically interpreted through the use of momentum indicators, which are mathematical calculations based on the price or volume of an asset. When momentum is positive, it suggests the price of an asset is on an upward trajectory, and when it's negative, it indicates a downward price trend. A high positive momentum value could signal an overbought market condition, potentially leading to a price correction, while a low negative momentum might indicate an oversold market, potentially signaling a price rebound. Momentum and price action are inherently intertwined. Momentum often precedes price movements, serving as an early warning system for upcoming changes in price trends. Traders use momentum as a way to gauge the strength behind price movements, allowing them to better time their entry and exit strategies. For instance, a sudden decrease in momentum in an upward trending market might suggest the potential for an upcoming price reversal, providing traders an opportunity to sell before the prices drop. MACD involves using two moving averages of an asset's price, typically the 12-day and 26-day exponential moving averages. The MACD is calculated by subtracting the longer-term moving average from the shorter-term moving average. A positive MACD value suggests upward momentum, while a negative value indicates downward momentum. The Relative Strength Index is a momentum oscillator that measures the speed and change of price movements. The RSI oscillates between zero and 100 and is typically used to identify overbought or oversold conditions in a market. An RSI value above 70 suggests an overbought condition, while a value below 30 suggests an oversold condition. The Stochastic Oscillator is a momentum indicator that compares a particular closing price of a security to a range of its prices over a certain period of time. The oscillator's reading is above 80 when prices are near the top of the range, and below 20 when prices are near the bottom of the range. This can help traders identify potential price reversals. ROC is another momentum indicator, representing the velocity of price changes. It measures the percentage change in price between the current price and the price a certain number of periods ago. The ROC indicator can be used to confirm price moves or detect divergences; for example, if a price is making new highs, but the ROC is failing to surpass its previous highs, it could indicate a price decline is coming. The Momentum Line is a simple but powerful indicator that measures the rate of change in price. It is calculated by comparing the current closing price to a closing price "n" periods ago. If the momentum line is above zero and rising, it indicates that the rate of ascent is increasing. If it's below zero and falling, it means the rate of descent is increasing. Momentum indicators are a vital tool in the trend following strategy, where traders aim to profit from the continuation of existing trends. Here, momentum indicators are used to confirm the strength of the trend and signal potential reversal points. For instance, a drop in momentum during an upward trend might indicate a looming price reversal. Reversal trading strategy aims to profit from the reversal of trends. Momentum indicators can help identify overbought or oversold conditions, signaling potential trend reversals. For example, if the RSI is above 70, the market could be overbought, and a reversal might be imminent. In the breakout trading strategy, traders seek to enter the market as early as possible during trend formation. Momentum indicators can help identify these breakout points. For instance, an upward surge in the MACD might suggest a bullish breakout. Swing trading involves profiting from price swings over a short to medium-term period. Momentum indicators can provide valuable insights into the strength and duration of the price swings, helping swing traders to time their trades. The Efficient Market Hypothesis asserts that at any given time, asset prices fully reflect all available information. If the EMH holds true, no investor could achieve consistently higher profits than the average, even with the best investment strategy. Momentum, with its emphasis on trend continuation, challenges the EMH. It suggests that markets are not always efficient, and price trends can persist over time, allowing traders to profit from momentum-based strategies. This deviation from EMH is often attributed to behavioral biases and market frictions. There's considerable empirical evidence supporting the presence of momentum in financial markets. Numerous studies have documented the profitability of momentum strategies across different asset classes and markets. However, some research also points to periods of momentum crashes, where momentum strategies perform poorly, often during market reversals or high-volatility periods. These findings suggest momentum effects may be conditional, underscoring the importance of risk management in momentum-based trading. Momentum phenomena are often attributed to behavioral biases of investors, including herding, anchoring, and confirmation bias. These biases can cause investors to underreact or overreact to market information, leading to price momentum. Industry momentum refers to the phenomenon where stocks from the same industry exhibit similar momentum effects. This can be due to common factors affecting these stocks, such as industry news, market trends, or economic developments. Cross-sectional momentum refers to the strategy of buying assets that have outperformed and selling assets that have underperformed over a specific period. It's based on the observation that asset returns can exhibit relative momentum. Time-series momentum, on the other hand, involves a strategy based on a single asset's past returns. If an asset's return was positive over a certain period, a time-series momentum strategy would take a long position, and vice versa. Behavioral finance suggests that psychological biases can drive momentum. For instance, investors may be slow to update their beliefs in response to new information (anchoring), or they may place too much weight on recent information (recency bias), causing price momentum. Herd behavior refers to the tendency of investors to mimic the actions of the majority. This can lead to price trends becoming self-reinforcing, contributing to momentum. Both overreaction and underreaction can drive momentum. Overreaction, where prices move too far in response to news, can create price reversals. Underreaction, where prices move too little, can create price momentum as prices slowly adjust to the news. One of the key benefits of momentum trading is the ability to capitalize on market trends. By identifying the direction and strength of a trend, traders can position themselves to profit from continued price movements in that direction. Momentum trading can offer high profit potential, especially in volatile markets. This strategy can deliver substantial returns when price trends are strong. Momentum trading involves the use of various technical indicators, like MACD, RSI, and the Stochastic Oscillator. These tools provide in-depth insights into market conditions, enabling traders to make informed decisions. Momentum trading can be effective in both bull and bear markets. Traders can 'go long' on a security when its price is in an uptrend, and 'go short' when it's in a downtrend. Momentum trading also involves robust risk management strategies. Traders typically use stop-loss orders to limit potential losses, protecting their investment capital if the market moves against them. One of the main drawbacks of momentum trading is its dependence on trend continuation. If a trend reverses unexpectedly, momentum traders can incur significant losses. Momentum trading often requires frequent trades, which can lead to overtrading. Not only does this increase transaction costs, but it can also cause traders to make impulsive, poorly-thought-out decisions. While momentum trading can profit from volatility, it's also susceptible to it. Sharp price reversals can trigger stop-loss orders, potentially resulting in losses. Momentum trading typically requires continuous market monitoring. It can be time-consuming, and any delay in responding to market changes can lead to losses. Momentum strategies can also be prone to momentum crashes – periods when a sharp reversal in price trends leads to substantial losses. These crashes often occur following market peaks when trends abruptly reverse. Momentum is a crucial concept in technical analysis that measures the speed and velocity of price changes in financial assets. It provides traders with valuable insights into market strength and weakness, allowing them to identify trend acceleration or deceleration over time. Momentum indicators such as MACD, RSI, Stochastic Oscillator, ROC, and Momentum Line offer different perspectives on price movement, aiding traders in identifying entry and exit points and adjusting their strategies accordingly. Momentum trading offers benefits such as capitalizing on market trends, high profit potential, and enhanced risk management. Nonetheless, it also has drawbacks, including the dependence on trend continuation, the risk of overtrading, susceptibility to market volatility, the need for continuous market monitoring, and the potential for momentum crashes. Traders should carefully consider these factors and employ robust risk management strategies when incorporating momentum into their trading approaches.What Is Momentum?
How Momentum Works
Theoretical Underpinnings of Momentum
Interpretation of Momentum
Relationship Between Momentum and Price Action
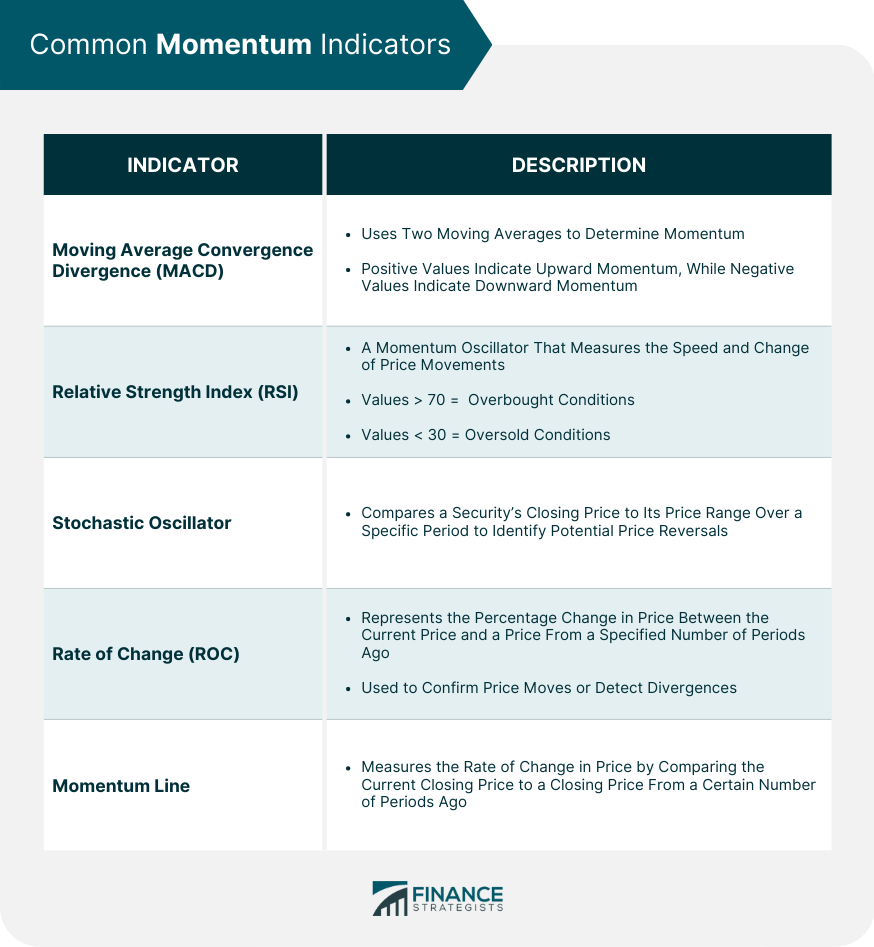
Common Momentum Indicators
Moving Average Convergence Divergence (MACD)
Relative Strength Index (RSI)
Stochastic Oscillator
Rate of Change (ROC)
Momentum Line
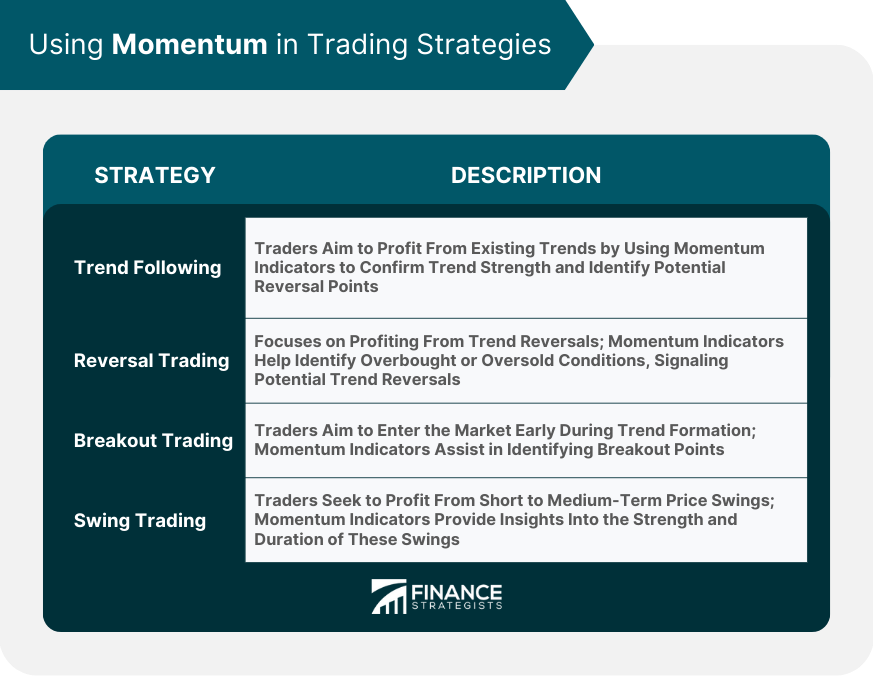
Using Momentum in Trading Strategies
Trend Following
Reversal Trading
Breakout Trading
Swing Trading
Momentum and Market Efficiency
Momentum and the Efficient Market Hypothesis (EMH)
Evidence Supporting and Contradicting Momentum
Momentum Anomalies and Phenomena
Momentum Phenomena
Industry Momentum
Cross-Sectional Momentum
Time-Series Momentum
Behavioral Finance and Momentum
Psychological Factors
Herd Behavior
Overreaction and Underreaction
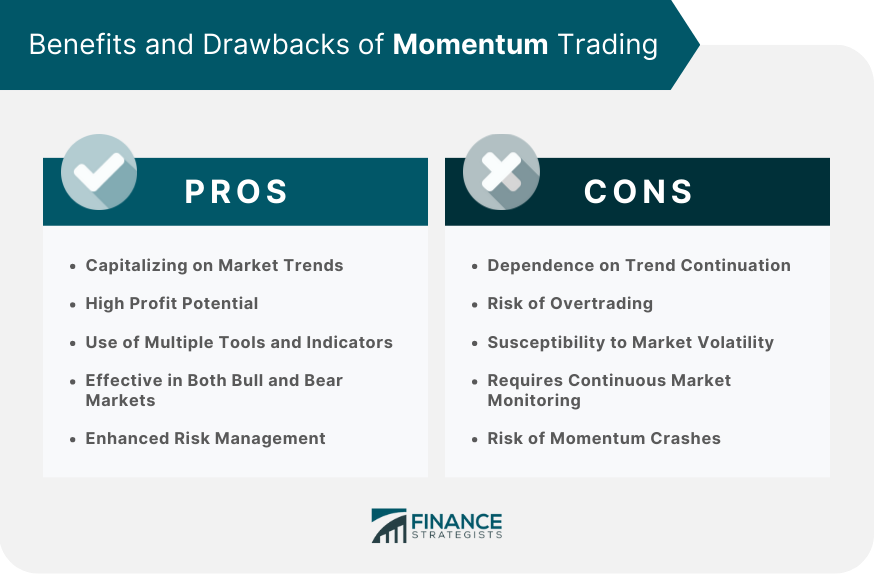
Benefits of Momentum Trading
Capitalizing on Market Trends
High Profit Potential
Use of Multiple Tools and Indicators
Effective in Both Bull and Bear Markets
Enhanced Risk Management
Drawbacks of Momentum Trading
Dependence on Trend Continuation
Risk of Overtrading
Susceptibility to Market Volatility
Requires Continuous Market Monitoring
Risk of Momentum Crashes
Final Thoughts
Momentum FAQs
The primary purpose of momentum indicators is to measure the speed and velocity of price changes in financial assets, providing traders with insights into the strength and direction of market trends.
Momentum indicators help traders in making trading decisions by identifying potential entry and exit points in the market. They allow traders to gauge the intensity of price movements, spot overbought or oversold conditions, and anticipate potential price reversals.
Yes, momentum trading can be effective in both bullish and bearish markets. Traders can take advantage of upward trends by going long on assets showing positive momentum, while in downtrends, they can go short on assets exhibiting negative momentum.
Some common momentum indicators used by traders include Moving Average Convergence Divergence (MACD), Relative Strength Index (RSI), Stochastic Oscillator, Rate of Change (ROC), and the Momentum Line. These indicators provide valuable information about price movements and trend strength.
The main risks associated with momentum trading include the dependence on trend continuation, the risk of overtrading, susceptibility to market volatility, the need for continuous market monitoring, and the potential for momentum crashes. Traders should be aware of these risks and implement effective risk management strategies to protect their capital.
True Tamplin is a published author, public speaker, CEO of UpDigital, and founder of Finance Strategists.
True is a Certified Educator in Personal Finance (CEPF®), author of The Handy Financial Ratios Guide, a member of the Society for Advancing Business Editing and Writing, contributes to his financial education site, Finance Strategists, and has spoken to various financial communities such as the CFA Institute, as well as university students like his Alma mater, Biola University, where he received a bachelor of science in business and data analytics.
To learn more about True, visit his personal website or view his author profiles on Amazon, Nasdaq and Forbes.


