
Comparable Company Analysis (CCA) is a financial analysis method used to value a company by comparing it to other similar companies in the same industry. The primary purpose of Comparable Company Analysis is to determine the relative value of a company by comparing its financial performance and valuation multiples to those of similar companies in the same industry. By analyzing the target company's valuation relative to its peers, analysts can identify whether the company is overvalued, undervalued, or fairly valued in the market. CCA is widely used by financial analysts, investors, and business owners to assess the value of a company and make informed investment decisions, merger and acquisition evaluations, and other strategic financial planning activities. By incorporating CCA into their financial analysis process, analysts can gain a deeper understanding of a company's market position, competitive advantages, and growth prospects, and make informed decisions about its future performance and value. Industry classification is essential because it allows analysts to compare the target company with other companies operating in the same industry and facing similar market conditions, competitive dynamics, and regulatory environments. Analysts typically use industry classification systems such as the Global Industry Classification Standard (GICS) or the North American Industry Classification System (NAICS) to categorize companies and identify potential comparables. Size and growth are crucial factors in identifying comparable companies, as they influence a company's market position, competitive advantages, and growth prospects. Companies with similar sizes and growth profiles are more likely to share similar market dynamics, operational characteristics, and financial performance. When identifying comparable companies, analysts consider factors such as market capitalization, revenue, and earnings growth, as well as other size and growth-related metrics. Geographical location is another important factor in identifying comparable companies, as it influences a company's market dynamics, competitive landscape, and regulatory environment. Companies operating in the same geographical region are more likely to face similar market conditions, competition, and regulatory requirements, making them suitable comparables for analysis. In identifying comparable companies, analysts typically focus on companies operating in the same country or region as the target company to ensure that the comparables share similar market dynamics and regional influences. Companies with similar business models and operational characteristics are more likely to share similar financial performance, competitive advantages, and growth prospects. Analysts consider factors such as the company's products or services, customer base, distribution channels, and operational structure to ensure that the comparables are truly similar to the target company in terms of their business model and operations. Financial statements are a critical source of data for Comparable Company Analysis, as they provide detailed information about a company's financial performance, assets, liabilities, and cash flows. Analysts use financial statements to calculate valuation multiples and compare the target company's financial performance to that of its peers. To ensure accurate and reliable analysis, analysts typically gather financial statements for at least three to five years to capture historical trends and fluctuations in financial performance. Publicly traded companies are required to disclose their financial statements, making them readily available for analysis. Market data includes information on stock prices, market capitalization, trading volume, and other market-related metrics that can be used to calculate valuation multiples and assess the target company's relative value. Analysts typically gather market data from financial news outlets, stock exchanges, and other sources to ensure that they have accurate and up-to-date information for their analysis. In addition to financial statements and market data, analysts may also gather other relevant information to support their Comparable Company Analysis. This information may include industry reports, analyst reports, company presentations, and news articles, among other sources. By gathering a wide range of information, analysts can gain a comprehensive understanding of the target company's market position, competitive landscape, and growth prospects, and ensure that their analysis is well-informed and accurate. One of the key challenges in Comparable Company Analysis is ensuring that the financial data of different companies is comparable. One factor that can affect comparability is the use of different accounting standards, such as Generally Accepted Accounting Principles (GAAP) or International Financial Reporting Standards (IFRS). To address this issue, analysts may need to adjust the financial data of the companies being compared to ensure that they are using the same accounting standards and that the data is directly comparable. Non-recurring items are one-time events that can have a significant impact on a company's financial performance, but are not expected to occur regularly. Examples of non-recurring items include gains or losses from asset sales, legal settlements, or natural disasters. When conducting Comparable Company Analysis, analysts may need to adjust the financial data of the companies being compared to exclude the impact of non-recurring items, ensuring that the analysis focuses on the companies' ongoing financial performance and growth prospects. Extraordinary items are events that are both unusual and infrequent in nature, such as large-scale corporate restructuring or the sale of a significant business unit. These items can have a significant impact on a company's financial performance and can distort valuation multiples if not properly accounted for. In Comparable Company Analysis, analysts may need to adjust the financial data of the companies being compared to exclude the impact of extraordinary items, ensuring that the analysis focuses on the companies' ongoing financial performance and growth prospects. These adjustments may include normalizing revenue or earnings for cyclical industries, adjusting for differences in capital structure, or accounting for differences in tax rates, among other factors. By making these adjustments, analysts can ensure that their Comparable Company Analysis is based on comparable financial data, allowing for a more accurate and reliable assessment of the target company's relative value. The price-to-earnings ratio (P/E) is a widely used valuation multiple that compares a company's stock price to its earnings per share (EPS). The P/E ratio is calculated by dividing the stock price by the EPS and is often used to assess whether a company's stock is overvalued, undervalued, or fairly valued relative to its peers. In Comparable Company Analysis, analysts calculate the P/E ratios for the target company and its comparables to determine their relative value and identify potential investment opportunities or areas of concern. The P/B ratio is calculated by dividing the stock price by the book value per share and is often used to assess a company's market value relative to its net asset value. In Comparable Company Analysis, analysts calculate the P/B ratios for the target company and its comparables to determine their relative value and identify potential investment opportunities or areas of concern. The Enterprise Value-to-EBITDA ratio (EV/EBITDA) is a popular valuation multiple that compares a company's enterprise value to its earnings before interest, taxes, depreciation, and amortization (EBITDA). The EV/EBITDA ratio is calculated by dividing the enterprise value by the EBITDA and is often used to assess a company's relative value and debt-adjusted performance. In Comparable Company Analysis, analysts calculate the EV/EBITDA ratios for the target company and its comparables to determine their relative value and identify potential investment opportunities or areas of concern. In addition to the valuation multiples mentioned above, analysts may use other multiples in their Comparable Company Analysis, depending on the industry and the specific characteristics of the companies being compared. Some of these other multiples may include price-to-sales ratio (P/S), price-to-cash flow ratio (P/CF), and price-to-earnings growth ratio (PEG), among others. By calculating a range of valuation multiples for the target company and its comparables, analysts can gain a comprehensive understanding of the companies' relative value and identify potential investment opportunities or areas of concern. In Comparable Company Analysis, valuation multiples are primarily used to assess the relative value of a company compared to its peers. Relative valuation is widely used and is considered a more objective and systematic way to assess a company's value. However, it relies on the assumption that the comparables are truly similar to the target company and may not account for differences in growth prospects, competitive advantages, or other factors that can affect a company's value. In some cases, analysts may also use valuation multiples to assess a company's absolute value, by comparing the target company's valuation multiples to historical norms or industry benchmarks. This approach can help analysts determine whether the company's stock is overvalued, undervalued, or fairly valued based on historical trends and industry norms. However, absolute valuation can be less reliable than relative valuation, as it may not account for changes in market conditions, competitive dynamics, or other factors that can affect a company's value. Comparable Company Analysis relies on a number of assumptions and is subject to biases, which can affect the accuracy and reliability of the analysis. For example, the method assumes that the comparables are truly similar to the target company and that the valuation multiples accurately reflect the companies' relative value. Additionally, the selection of comparables and valuation multiples can be influenced by the analyst's biases or preferences, which can result in a distorted or inaccurate assessment of the target company's value. In some cases, financial data may be unavailable or unreliable, particularly for private companies or companies operating in emerging markets. Furthermore, differences in accounting standards, reporting practices, and other factors can affect the comparability of financial data, requiring analysts to make adjustments to ensure that the data is directly comparable. Comparable Company Analysis may not fully account for changes in market conditions or competitive dynamics that can affect a company's value. For example, changes in interest rates, economic conditions, or industry trends can have a significant impact on a company's financial performance and valuation multiples, which may not be captured by the analysis. Additionally, Comparable Company Analysis may not fully account for differences in growth prospects, competitive advantages, or other factors that can affect a company's value, potentially resulting in an inaccurate or incomplete assessment of the company's relative value. Comparable Company Analysis is a widely used financial analysis method that can provide valuable insights into a company's relative value and identify potential investment opportunities or areas of concern. By comparing a company's financial performance and valuation multiples to those of similar companies in the same industry, analysts can assess the company's market position, growth prospects, and competitive advantages, and make informed decisions about its future performance and value. However, Comparable Company Analysis has its limitations, including assumptions and biases, data availability and quality, and market conditions and dynamics. To ensure the accuracy and reliability of the analysis, analysts should be aware of these limitations and use a combination of valuation methods, industry knowledge, and judgment to make well-informed decisions about a company's value and potential investment opportunities.What Is Comparable Company Analysis?
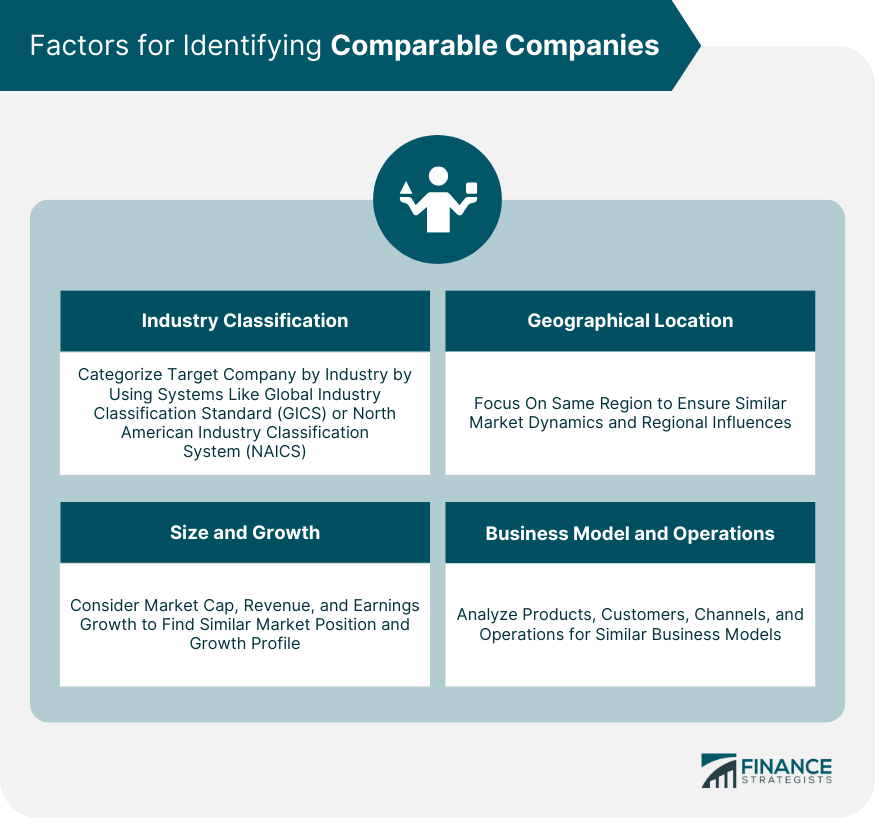
Identifying Comparable Companies
Industry Classification
Size and Growth
Geographical Location
Business Model and Operations
Gathering Data for Comparable Company Analysis
Financial Statements
Market Data
Other Relevant Information
Adjusting Financial Data for Comparability
Accounting Standards
Non-Recurring Items
Extraordinary Items
Other Adjustments
Calculating Valuation Multiples
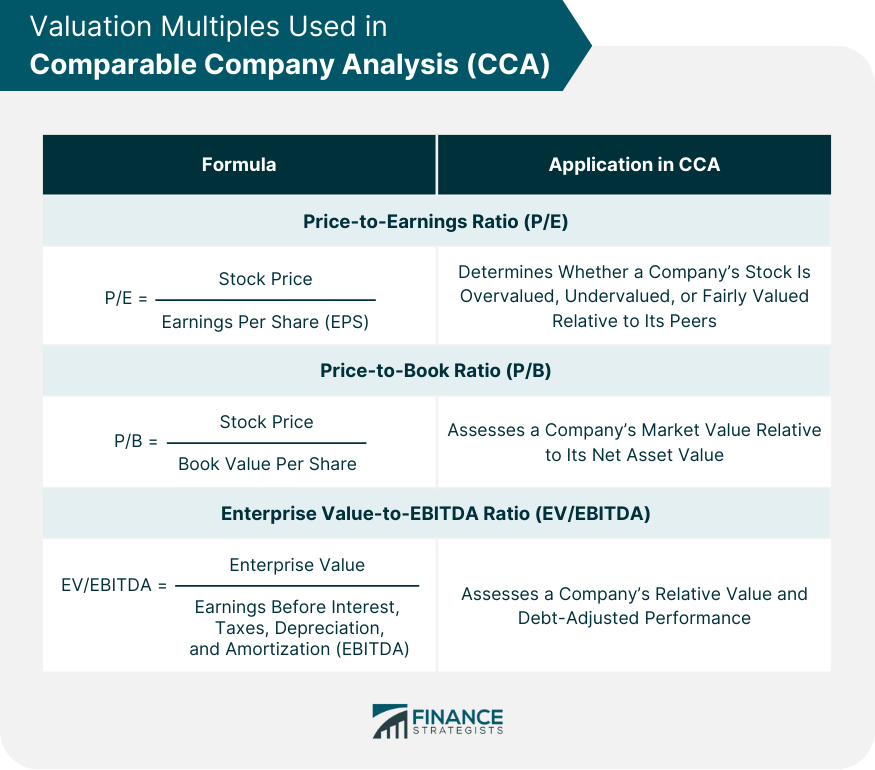
Price-to-Earnings Ratio (P/E)
Price-to-Book Ratio (P/B)
Enterprise Value-to-EBITDA Ratio (EV/EBITDA)
Other Multiples
Interpreting Valuation Multiples
Relative Valuation
Absolute Valuation
Limitations of Comparable Company Analysis
Assumptions and Biases
Data Availability and Quality
Market Conditions and Dynamics
Final Thoughts
Comparable Company Analysis FAQs
Comparable Company Analysis (CCA) is a valuation method that compares the financial metrics of similar companies in the same industry.
The steps for conducting a CCA include identifying comparable companies, gathering data, adjusting financial data for comparability, calculating valuation multiples, and interpreting the multiples.
The key factors to consider when identifying comparable companies include industry classification, size and growth, geographical location, and business model and operations.
The most commonly used valuation multiples in CCA include the price-to-earnings ratio (P/E), price-to-book ratio (P/B), and enterprise value-to-EBITDA ratio (EV/EBITDA).
The limitations of CCA include assumptions and biases, data availability and quality, and market conditions and dynamics. It is important to consider these limitations when using CCA in financial analysis.
True Tamplin is a published author, public speaker, CEO of UpDigital, and founder of Finance Strategists.
True is a Certified Educator in Personal Finance (CEPF®), author of The Handy Financial Ratios Guide, a member of the Society for Advancing Business Editing and Writing, contributes to his financial education site, Finance Strategists, and has spoken to various financial communities such as the CFA Institute, as well as university students like his Alma mater, Biola University, where he received a bachelor of science in business and data analytics.
To learn more about True, visit his personal website or view his author profiles on Amazon, Nasdaq and Forbes.


