
Price action refers to the movement of a security's price over time. This concept is crucial to technical analysis—an approach to investing that focuses on predicting future price movements based on past market data. Technical traders use price action as a method of interpreting information and making informed trading decisions. Price action is deeply intertwined with market psychology. The patterns observed in price charts often reflect the collective emotions of market participants. Every spike, every dip, each consolidation phase tells a story about traders' hopes, fears, expectations, and doubts. By studying price action, traders gain a unique insight into the prevailing market sentiment, which is invaluable in forecasting potential price movements. It provides the rawest and purest form of data directly from the markets. It allows traders to understand the market structure, identify trends, spot key support and resistance levels, and make informed predictions about potential future price movements. By mastering price action analysis, traders can gain an edge over the competition and increase their chances of success. These formations appear when the price of a security moves in a certain way over a specific period. Price patterns provide a way to visualize the supply and demand forces in the market, allowing traders to anticipate future price movements. Originating from 18th century Japan, these patterns provide valuable insights into the market's short-term sentiment. They are formed by one or more candlesticks, representing a specific time period's open, close, high, and low prices. Familiar patterns include the hammer, the shooting star, the bullish engulfing, and the bearish engulfing—each providing different market signals. A support level is a price level at which buyers tend to enter the market, preventing prices from falling further. Conversely, a resistance level is a price level where sellers usually enter the market, keeping prices from rising higher. Identifying these levels can help traders make profitable entry and exit decisions. Trend lines are lines drawn on a price chart that connect either a series of highs or lows. These lines illustrate the prevailing direction of price—upwards, downwards, or sideways. A breakdown of a trend line often indicates a potential reversal of the current trend, offering a significant trading signal. Double tops and bottoms are common price action patterns signaling potential reversals. A double top forms when the price hits a certain level twice without breaking through, suggesting a bearish reversal. On the other hand, a double bottom occurs when the price hits a particular level twice without falling below, signaling a bullish reversal. The head and shoulders pattern is a highly reliable price action pattern indicating a potential bearish reversal. It consists of three peaks—the left shoulder, the head, and the right shoulder, with the head being the highest peak. The inverse head and shoulders pattern, on the other hand, signifies a bullish reversal. Price action traders can take advantage of the trend by entering trades in the trend's direction, be it upward or downward. Identifying the trend through trend lines, moving averages, and other technical tools can help traders determine the most profitable trades. In range-bound markets, prices move within a defined range without a clear direction. Here, traders can use price action to identify key support and resistance levels and trade based on bounces off these levels. High volatility periods can present both opportunities and risks. With increased price fluctuations, traders can potentially make substantial profits. However, the risk of significant losses is also heightened. Traders must be cautious, utilizing tools such as stop-loss orders and proper position sizing to manage their risk. Technical indicators are mathematical calculations based on a security's price and volume. They provide unique perspectives on the market and help traders confirm price action patterns. Examples include moving averages, the relative strength index (RSI), and the moving average convergence divergence (MACD). Price action and indicator-based trading both aim to predict future price movements. However, while price action trading focuses on raw price movements, indicator-based trading relies on mathematical calculations. These methods can be combined for more robust trading decisions. Day traders can utilize price action to make quick, informed decisions. They can study price action patterns on short-term charts to identify intraday trading opportunities. Swing traders, who typically hold positions for several days to weeks, can use price action to identify medium-term trends and reversals. They can analyze chart patterns on daily and weekly charts to determine potential trading opportunities. Long-term investors can use price action to identify overarching trends and key levels of support and resistance. They can analyze price action on monthly or quarterly charts to determine potential investment opportunities. While one trader might see a bullish signal in a specific price pattern, another might interpret the same pattern as neutral or even bearish. This subjectivity can lead to inconsistencies and can make it difficult to automate a price action trading strategy. Identifying and interpreting price patterns is not something that can be learned overnight. It requires a deep understanding of market mechanics and a keen eye for detail, which often comes only after years of studying and trading in the markets. Price action trading can often lead to false signals. For instance, a trader might identify what they believe to be a head and shoulders pattern, implying a potential bearish reversal. However, the pattern could fail, and the price might continue in the original direction. Like all forms of technical analysis, price action trading is based on the assumption that history will repeat itself. However, past performance is not always indicative of future results. Market conditions change, and a pattern that worked well in the past might not work in the future. Price patterns can form and break down in a matter of minutes, especially in highly volatile markets. Therefore, traders need to be vigilant and stay on top of their charts, which can be time-consuming and mentally draining. Price action analysis is a fundamental tool for traders employing technical analysis. It allows them to interpret market data and gain insights into the prevailing market sentiment. By studying price patterns, such as candlestick patterns and support/resistance levels, traders can make informed predictions about potential future price movements. Price action analysis can be implemented in different market conditions, including trending markets, range-bound markets, and high volatility periods. However, it is important to acknowledge the challenges and pitfalls associated with price action trading, such as subjectivity, the need for experience and skill, false signals, overemphasis on past performance, and the requirement for constant monitoring of the markets. In spite of these challenges, mastering price action analysis can provide traders with a competitive edge and increase their chances of success. While subjectivity is inherent in price action trading, gaining experience and deepening knowledge can help mitigate its impact. By combining price action analysis with technical indicators, traders can potentially enhance the accuracy of their predictions. Price action analysis remains a valuable tool for traders to understand market dynamics and make well-informed trading decisions.What Is Price Action?
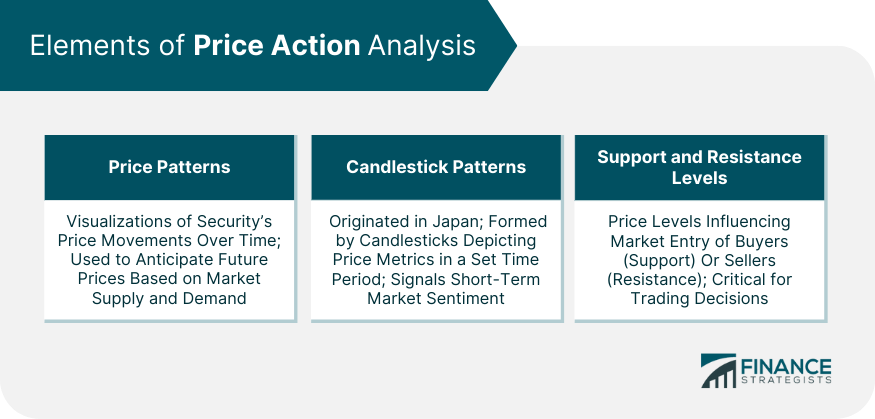
Elements of Price Action Analysis
Price Patterns
Candlestick Patterns
Support and Resistance Levels
Key Price Action Patterns
Trend Lines
Double Tops and Bottoms
Head and Shoulders Patterns
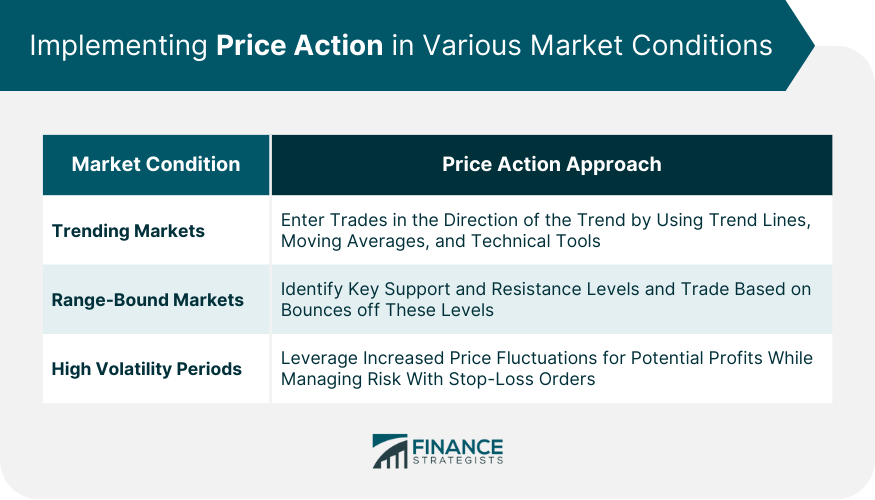
Implementing Price Action in Various Market Conditions
Trending Markets
Range-Bound Markets
High Volatility Periods
Price Action and Indicators
Role of Technical Indicators
Price Action vs Indicator-Based Trading
Price Action in Different Timeframes
Day Trading
Swing Trading
Long-Term Investing
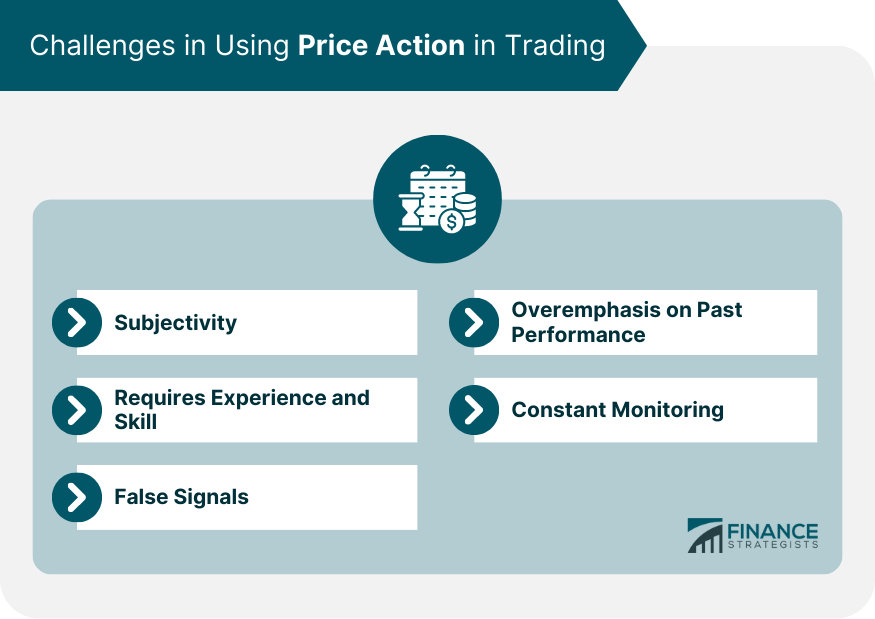
Challenges in Using Price Action in Trading
Subjectivity
Requires Experience and Skill
False Signals
Overemphasis on Past Performance
Constant Monitoring
Final Thoughts
Price Action FAQs
Price action analysis provides traders with direct and raw data from the markets, allowing them to understand market structure, identify trends, spot key support and resistance levels, and make informed predictions about potential future price movements.
Yes, price action analysis can be applied to various timeframes. It is useful for day traders looking for intraday opportunities, swing traders identifying medium-term trends and reversals, as well as long-term investors identifying overarching trends and key levels of support and resistance.
Price action analysis focuses on interpreting raw price movements, while indicator-based trading relies on mathematical calculations derived from price and volume data. Both methods aim to predict future price movements and can be combined for more robust trading decisions.
Price action trading involves subjectivity, as different traders may interpret the same price patterns differently. It also requires experience and skill to accurately identify and interpret price patterns. Traders should be aware of false signals and the potential for past performance to not always predict future results. Additionally, price action trading demands constant monitoring of the markets, which can be time-consuming and mentally draining.
Automating a price action trading strategy can be challenging due to its subjective nature. The interpretation of price patterns often requires human judgment and experience. While certain aspects of price action analysis can be automated, a complete automation of a price action trading strategy is difficult to achieve.
True Tamplin is a published author, public speaker, CEO of UpDigital, and founder of Finance Strategists.
True is a Certified Educator in Personal Finance (CEPF®), author of The Handy Financial Ratios Guide, a member of the Society for Advancing Business Editing and Writing, contributes to his financial education site, Finance Strategists, and has spoken to various financial communities such as the CFA Institute, as well as university students like his Alma mater, Biola University, where he received a bachelor of science in business and data analytics.
To learn more about True, visit his personal website or view his author profiles on Amazon, Nasdaq and Forbes.


