
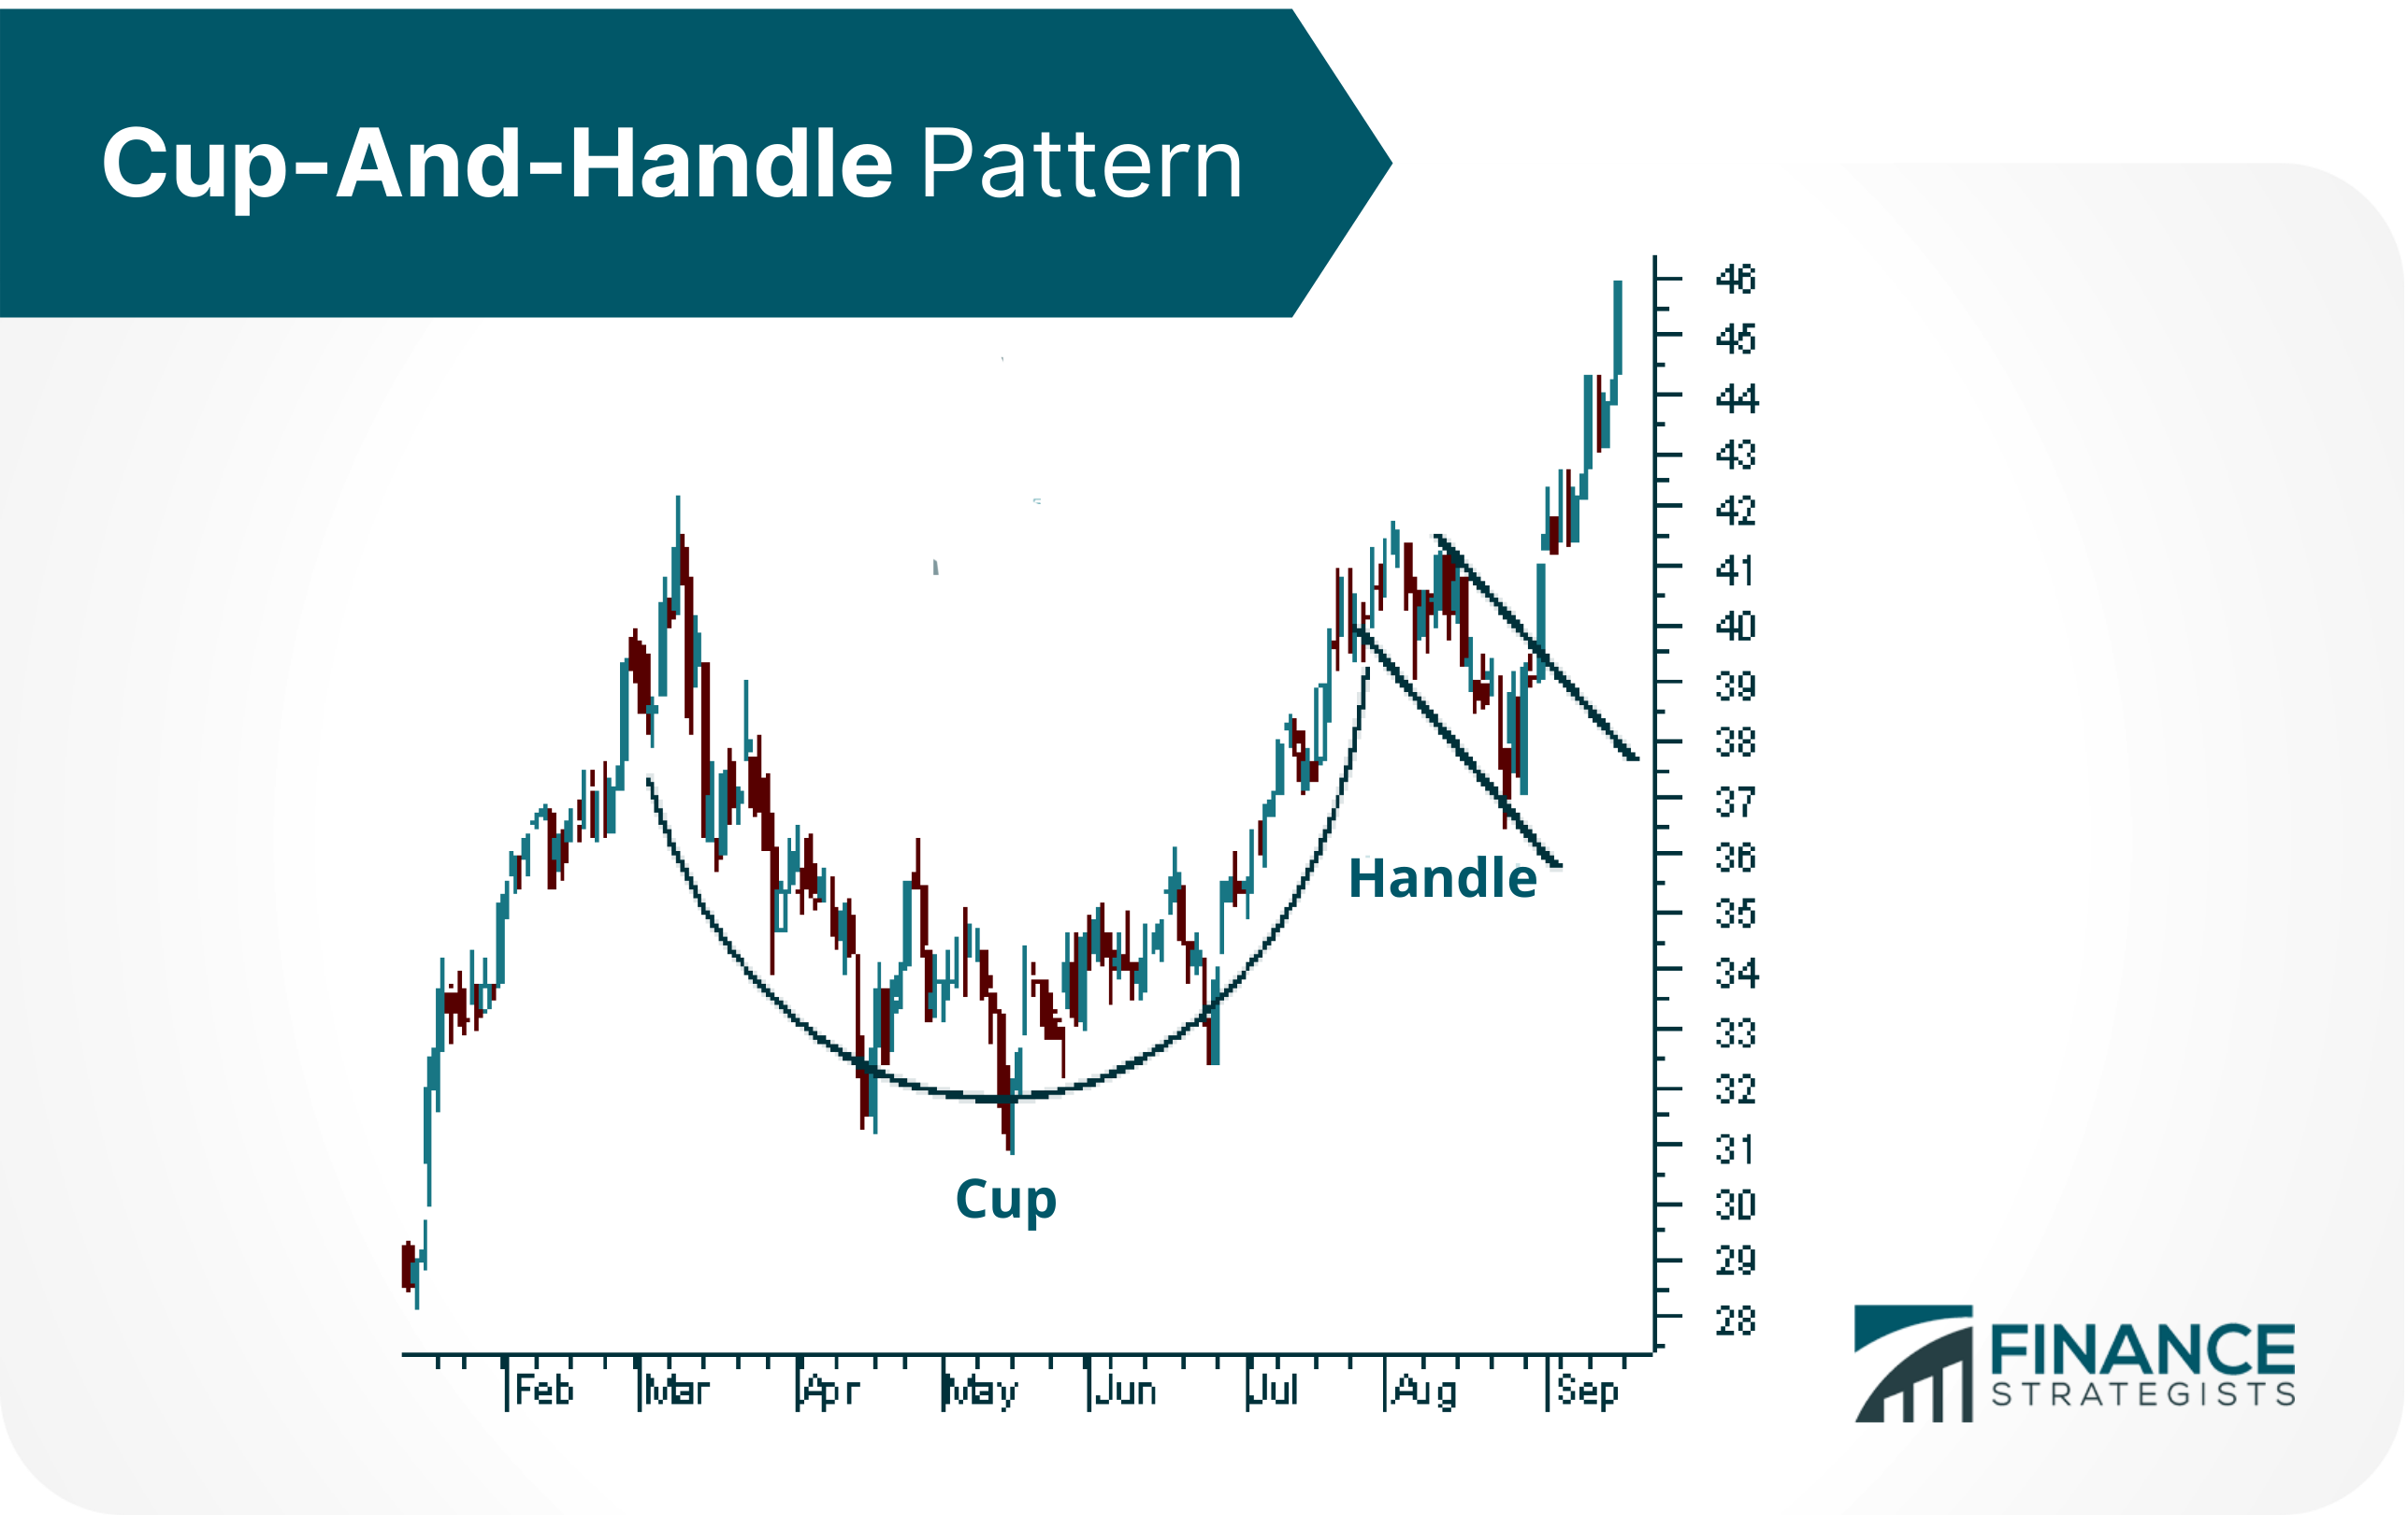
A cup-and-handle pattern is a popular technical analysis pattern. Technical analysis is the practice of using past trading activity, such as price and volume, to predict a stock's future price movement. Price makes a straight or nearly straight down move before reversing and heading up. The cup forms when this decline reaches at least 20%. After reaching the bottom of the cup, the price begins to rise again in order to make a handle. It rises about halfway toward its peak, then stalls for several days or weeks before continuing its upward trend toward the full extent of the gains from its initial drop in price. A breakout above resistance signals that an uptrend may continue onto further gains. Many analysts look for confirmation of a strong buy signal in the form of a volume spike. This means that a lot of people are going into the market, which can support even more price increases in the future. The following are the stages that happen in a cup-and-handle pattern: A cup-and-handle pattern is usually interpreted as a bullish continuation pattern. The implication is that the downward trend from the previous move has ended and that prices will resume their uptrend. The buy signal is confirmed when the stock breaks above the resistance level that capped the uptrend during the handle formation. This breakout should occur with high volume to indicate that there is strong investor interest in buying the stock at these levels. Once the breakout occurs, the stock is likely to keep increasing in value until it reaches its previous high or even higher. A cup and handle stock pattern is formed over time on a stock's chart when there is an upward trend followed by a pause or consolidation period where prices have been decreasing then follows another rise after the decrease. Some traders will see this type of pattern as a continuation pattern or a reversal pattern. This formation comes from how some traders use momentum strategies to trade patterns and trends seen on charts while also identifying areas where buying interest may diminish along with indecision among buyers causing them to stop increasing their bid prices giving sellers more control since buyers are no longer pushing prices higher (thus the consolidation period). When the stock price moves above the resistance line that is created from the high of the handle, it is said to have broken out and this signals to traders that there is potential for more upside price movement. The cup-and-handle pattern can be seen on all types of charts including bar, candlestick, and point and figure. After a significant decline, the price rises to form a cup—this could take weeks or months. The handle forms when the price stalls and ranges sideways before heading upwards again. A breakout occurs when the stock price pushes above the resistance level created by the highs of the handle. Many traders look for volume confirmation to signal that a buy is warranted. A large increase in volume during the breakout could suggest that institutional investors are getting behind the stock. This could lead to even more price increases in the future. The cup-and-handle pattern isn't always reliable and should not be used in isolation. Traders should look for other technical signals to support their decisions. Some factors that could invalidate the pattern include: if the stock gaps up or down on significant news, if there is a major change in the company's fundamentals, or if there is a large dividend payout. The cup-and-handle pattern doesn't indicate how long a price rise will last. The breakout might only be short term and the stock could drop back below the handle relatively quickly. If traders are trying to use the cup-and-handle pattern on stocks with low liquidity, they may face increased risk. This is because it's difficult to enter or exit positions when there isn't enough volume of shares changing hands each day—a large spread between the bid and ask prices can make it expensive to trade, too. There are many different types of trading patterns that traders can study to help them make better investment decisions so they benefit from trends in the market. The cup-and-handle pattern is just one of these and should not be used in isolation. Volume confirmation is key when trying to identify a stock that is ready to break out. Look for large increases in volume to suggest that institutional investors are getting behind the stock. This could lead to even more price increases in the future. If you're thinking about trading stocks, it's important to learn as much as you can about how the market works and all of the different patterns that traders look for. There is no one perfect solution for everyone, so it's important to find strategies that fit your personality and risk tolerance levels. Illustration of a Cup-And-Handle Pattern
What Does a Cup-And-Handle Indicate?
What Happens in a Cup-And-Handle Pattern?
Limitations of the Cup-And-Handle Pattern
Final Thoughts
Cup-And-Handle Pattern FAQs
Cup-And-Handle Pattern is a type of chart pattern that traders use to identify potential buying opportunities. It occurs when the stock price has been decreasing then follows another rise after the decrease. This formation comes from how some traders use momentum strategies to trade patterns and trends seen on the chart.
Cup-And-Handle Pattern can be identified by looking at a chart and noting that the stock has experienced a significant decline, followed by an upswing. After this upswing, there is typically a period of consolidation or sideways movement which forms the “handle” of the pattern. This handle should be relatively short-lived and is then followed by a breakout that signals potential buying opportunities.
Traders should look for volume confirmation when trying to identify Cup-And-Handle Patterns. A large increase in volume during the breakout could suggest that institutional investors are getting behind the stock, which could lead to even more price increases in the future. Additionally, traders should be aware of certain factors that could invalidate the pattern. These include if the stock gaps up or down on significant news, if there is a major change in the company's fundamentals, or if there is a large dividend payout.
Cup-And-Handle Pattern isn't always reliable and should not be used in isolation. Traders should look for other technical signals to support their decisions. Additionally, it doesn't indicate how long a price rise will last, so the breakout might only be short term and the stock could drop back below the handle relatively quickly.
Other technical analysis tools include indicators, chart patterns, and volume. Each of these can be used to help traders make better investment decisions. Indicators are calculations that attempt to measure a security's underlying trend, momentum, or volatility. Chart patterns are formations that appear on a stock's price chart and often repeat themselves. Volume is the number of shares that change hands each day and can be used to confirm breakouts and trends.
True Tamplin is a published author, public speaker, CEO of UpDigital, and founder of Finance Strategists.
True is a Certified Educator in Personal Finance (CEPF®), author of The Handy Financial Ratios Guide, a member of the Society for Advancing Business Editing and Writing, contributes to his financial education site, Finance Strategists, and has spoken to various financial communities such as the CFA Institute, as well as university students like his Alma mater, Biola University, where he received a bachelor of science in business and data analytics.
To learn more about True, visit his personal website or view his author profiles on Amazon, Nasdaq and Forbes.


