
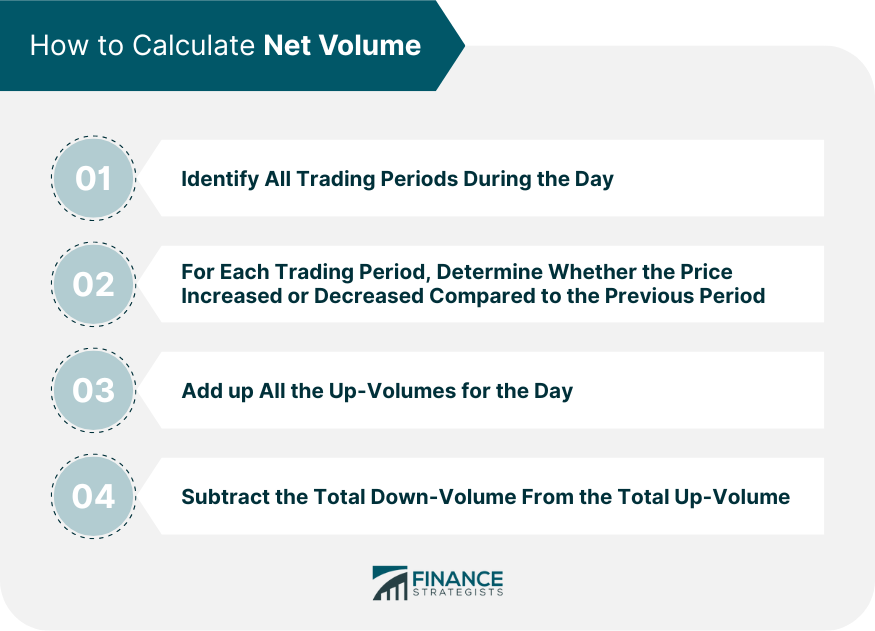
Net volume refers to the difference between a financial instrument's up-volume and down-volume on a given day. It provides an estimate of whether more trading was completed on an up or down tick. In the realm of technical analysis, volume serves as a key determinant of market sentiment. Technical analysts often use these volume indicators to help predict future market behavior. Net volume is especially useful in this context because it helps analysts identify periods of buying or selling pressure. By looking at net volume, analysts can better understand the force behind a price move. It can help inform trading decisions. To calculate net volume, one needs to know the volume of trades executed during periods when the price of the security was increasing (up-volume) and the volume of trades executed when the price was decreasing (down-volume). Subtracting down-volume from up-volume gives the net volume. The process of calculating net volume involves these steps: 1. Identify all trading periods during the day. A trading period could be as short as one minute or as long as one hour, depending on the data available. 2. For each trading period, determine whether the price increased or decreased compared to the previous period. If it increased, the volume for that period is considered up-volume. If it decreased, the volume is considered down-volume. 3. Add up all the up-volumes for the day. Do the same for all the down-volumes. 4. Subtract the total down-volume from the total up-volume. The result is the net volume. If in a trading day, a total of 2,000,000 shares were traded during periods of price increase (up-volume), and 1,500,000 shares were traded during periods of price decrease (down-volume), the net volume for the day would be 500,000 (2,000,000 - 1,500,000). A positive net volume indicates that there was more buying pressure for the security during the day, as more volume was traded during periods of price increase. Conversely, a negative net volume implies more selling pressure, as more volume was traded during periods of price decrease. Net volume can fluctuate from day to day. Sharp increases in net volume could indicate growing interest in a security, which might precede a price increase. On the other hand, sharp decreases could indicate increasing selling pressure, which might precede a price decrease. Net volume is one of many volume indicators used in technical analysis. Other indicators include the On Balance Volume (OBV), Volume Rate of Change, and the Accumulation/Distribution Line (ADL). Each has its own unique way of interpreting volume data, and each can provide different insights. Analysts often use several volume indicators in conjunction to get a comprehensive view of the market. The OBV, created by Joe Granville, is another popular volume indicator. Like net volume, OBV also measures buying and selling pressure. However, it does so by adding the day's volume to a cumulative total when the security's price closes up, and subtracting the volume when the price closes down. The continuous total of the OBV can help traders identify when volume is disproportionately flowing into or out of a particular security. Unlike net volume, OBV considers the close price relative to the previous close price, not just whether volume was up or down. VROC is a volume-based oscillator that measures the rate of change in volume. This indicator helps identify spikes in trading volume, which often occur during significant price movements, or just before them. Unlike net volume, which just looks at the difference between up-volume and down-volume, VROC examines the speed at which volume is changing, regardless of price direction. A limitation of VROC is that it may often provide false signals, as not all volume spikes will result in significant price moves. The ADL is a volume-based indicator designed to measure the cumulative flow of money into and out of a security. It differs from net volume and OBV as it considers the close price relative to the high-low range of the security's price for the day, in addition to volume. This helps in identifying whether volume is being accumulated (buying pressure) or distributed (selling pressure). A rising ADL indicates that buying pressure is prevailing, while a falling ADL suggests selling pressure. However, a major limitation of ADL is that it doesn't account for price changes, only whether the price finished higher or lower than the previous day's price. A bullish sentiment, characterized by optimism, is often indicated by a positive net volume, while a bearish sentiment, marked by pessimism, could be suggested by a negative net volume. Traders utilize these insights to assess the robustness of a trend and anticipate possible trend reversals. When the price increases on a day with higher net volume, it signifies robust buying pressure. On the other hand, strong selling pressure is implied on a day when the price drops coinciding with a high net volume. For instance, a consistently positive net volume accompanying an increasing price of a security may denote a robust uptrend. Conversely, a persistent negative net volume in tandem with a decreasing price of a security might suggest a significant downtrend. Changes in net volume can sometimes foreshadow a price reversal. For instance, if a security is in an uptrend but the net volume starts decreasing, it might indicate a weakening of the trend and a potential price reversal. Net volume works well with other technical indicators, offering traders a more holistic view of the market. For example, combining net volume with indicators like moving averages or relative strength index (RSI) can enhance a trader's decision-making process. For instance, if the price of a security is ascending and is associated with high net volume, a trader might opt to purchase that security. On the contrary, a trader might decide to offload a security when its price is descending and the net volume is significantly high. Net volume does not take into account the magnitude of price changes, only the direction of the change. For instance, a minor price increase with a large volume is treated the same as a significant price increase with the same volume. High net volume doesn't necessarily guarantee a price increase. It can sometimes lead to false signals if not used in conjunction with other technical indicators. For example, a high net volume might indicate high buying pressure, but if the market sentiment suddenly changes, the price might drop instead of rise. Net volume can be influenced by day-to-day fluctuations in trading volume. This can make it challenging to discern longer-term trends based solely on net volume data. The calculation of net volume depends heavily on the accurate reporting of trading volume. However, this can be a challenge, particularly in less-regulated markets or with over-the-counter securities, where volume data may not be as readily available or reliable. Interpreting net volume requires a good understanding of the market and trading dynamics. Traders who are new to using volume indicators might find it challenging to accurately interpret the data. In markets with low liquidity or thinly traded securities, net volume may be less useful. This is because a small number of trades can significantly impact the net volume, potentially leading to misleading signals. Net volume is a valuable indicator in technical analysis that helps traders gain insights into market sentiment, buying and selling pressure, trend strength, and potential price reversals. By analyzing the difference between up-volume and down-volume, net volume provides a measure of trading activity during periods of price increase or decrease. It complements other volume indicators and can improve entry and exit points when used in conjunction with other technical tools. However, net volume has limitations and challenges, such as neglecting price magnitude, potential misleading signals, sensitivity to daily fluctuations, dependence on accurate data, difficulties in interpretation, and limited usefulness in illiquid markets. Traders should be aware of these limitations and consider using net volume in combination with other indicators to make well-informed trading decisions.What Is Net Volume?
Calculation of Net Volume
Basic Elements
Step-By-Step Process
Example of Net Volume Calculation
Interpretation of Net Volume
Reading Positive and Negative Net Volume
Implications of Fluctuating Net Volume
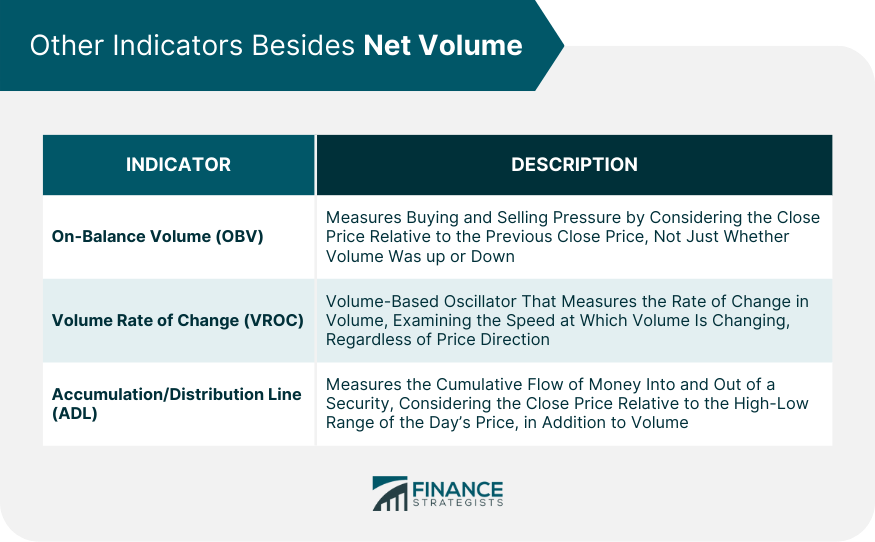
Other Indicators Besides Net Volume
On-Balance Volume (OBV)
Volume Rate of Change (VROC)
Accumulation/Distribution Line (ADL)
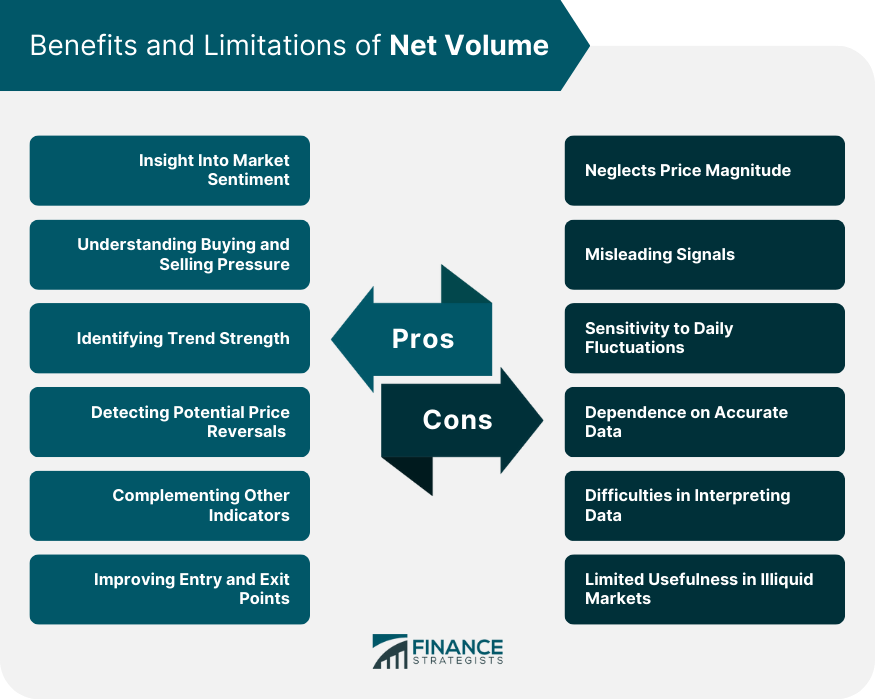
Benefits of Using Net Volume
Insight Into Market Sentiment
Understanding Buying and Selling Pressure
Identifying Trend Strength
Detecting Potential Price Reversals
Complementing Other Indicators
Improving Entry and Exit Points
Limitations and Challenges With Net Volume
Neglects Price Magnitude
Misleading Signals
Sensitivity to Daily Fluctuations
Dependence on Accurate Data
Difficulties in Interpreting Data
Limited Usefulness in Illiquid Markets
Final Thoughts
Net Volume FAQs
Net volume calculates the difference between up-volume and down-volume, providing insights into buying and selling pressure. Other volume indicators, such as On Balance Volume (OBV), Volume Rate of Change (VROC), and Accumulation/Distribution Line (ADL), have different methods of interpreting volume data and offer unique insights into market dynamics.
Net volume is a useful tool in technical analysis, but it should not be relied upon as the sole predictor of price movements. It is recommended to combine net volume with other technical indicators and analysis techniques to get a more comprehensive view of the market and improve forecasting accuracy.
Net volume may be less useful in illiquid markets or thinly traded securities where a small number of trades can significantly impact the net volume, potentially leading to misleading signals. It is more effective in markets with higher liquidity and a larger number of trades.
The frequency of monitoring net volume depends on the strategy and timeframe of the trader. Some traders may monitor net volume on a daily basis, while others may use longer timeframes such as weekly or monthly. It is important to find a balance between monitoring frequency and the desired level of detail in the analysis.
Net volume can be used for both short-term trading and long-term investing. In short-term trading, net volume can help identify intraday buying or selling pressure, aiding in determining entry and exit points. For long-term investing, net volume can provide insights into the overall sentiment and trend strength of a security, assisting in making informed investment decisions.
True Tamplin is a published author, public speaker, CEO of UpDigital, and founder of Finance Strategists.
True is a Certified Educator in Personal Finance (CEPF®), author of The Handy Financial Ratios Guide, a member of the Society for Advancing Business Editing and Writing, contributes to his financial education site, Finance Strategists, and has spoken to various financial communities such as the CFA Institute, as well as university students like his Alma mater, Biola University, where he received a bachelor of science in business and data analytics.
To learn more about True, visit his personal website or view his author profiles on Amazon, Nasdaq and Forbes.


