
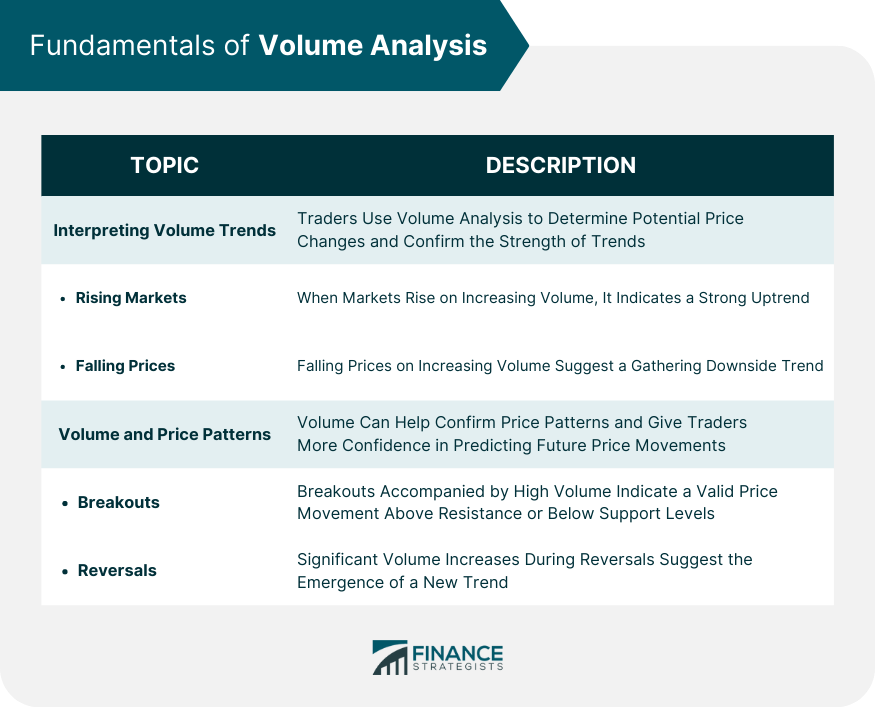
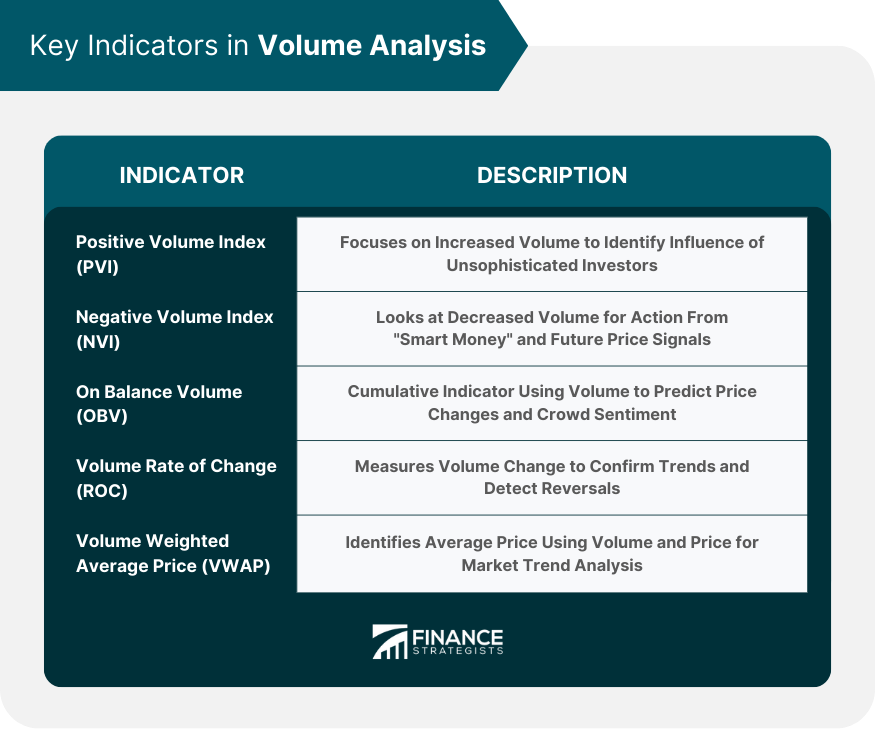
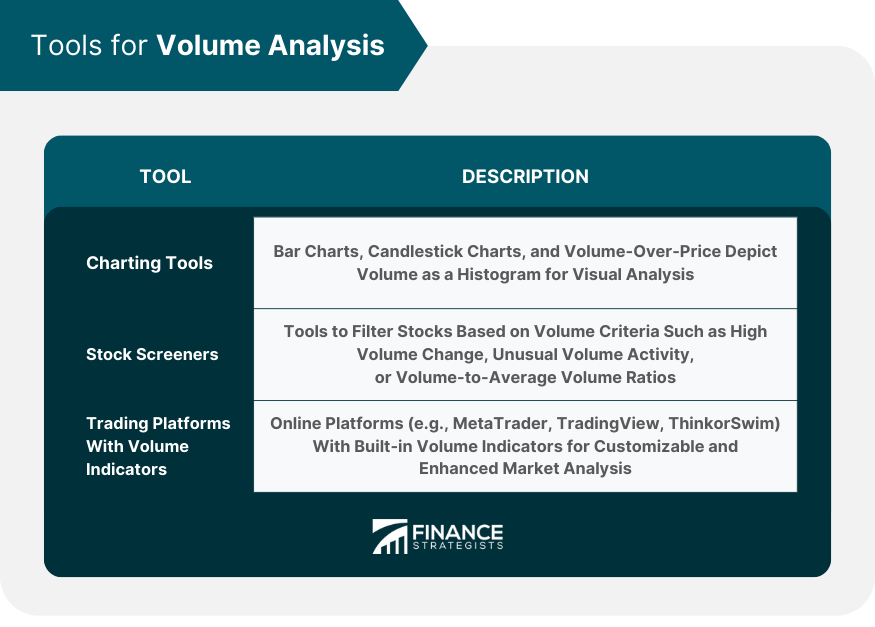
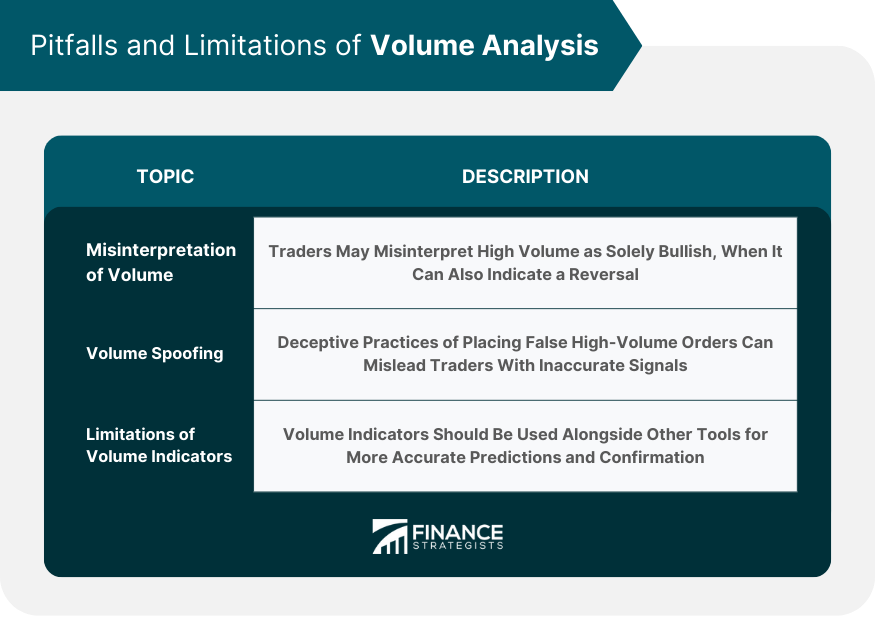
Volume analysis is a technical analysis technique used to study the trading volumes of securities, interpreting the number of shares or contracts traded within a specific timeframe. This method is pivotal for understanding market dynamics as it provides insights into market liquidity, momentum, and investor sentiment. High trading volume signifies a high level of interest in a security, indicating an active and liquid market, whereas low volume could point to less interest and potential liquidity issues. Trading volume also gauges market strength: high volumes usually coincide with significant market moves. Increasing volume in rising markets suggests robust trends, whereas growing volume during falling prices may indicate a strengthening downward trend. Trading volume is the number of shares or contracts traded in a security or an entire market during a given period. Volume is a vital indicator as it reflects the level of activity in a security and helps traders understand the significance of specific price movements. There is a strong relationship between trading volume and price movements. When volume increases, it often signals that a price change is likely to be sustained. For instance, a sudden price jump on high volume is more likely to indicate a significant trend that could continue, compared to a similar price move on low volume. High trading volumes often signify increased trader interest and the potential for significant price changes. In contrast, low volumes may indicate a lack of interest or a period of consolidation before a price breakout. Traders use volume analysis to determine potential price changes and confirm the strength of trends. When markets are rising on increasing volume, it indicates a strong uptrend. This scenario suggests that the market participants are enthusiastic about the asset, causing the price to increase. Conversely, if prices fall on increasing volume, the trend is gathering strength to the downside. It implies that selling pressure is building, and the price might continue to decline. Volume can help confirm price patterns and give traders more confidence in predicting future price movements. A breakout occurs when an asset's price moves above a resistance level or below a support level on the chart pattern. If this move is accompanied by a high volume, it's a strong signal that the breakout is valid. Reversals are changes in the prevailing price trend. If volume increases significantly during a reversal, it could indicate a new trend is taking shape. Traders use several volume-based indicators to analyze and predict market trends. The Positive Volume Index (PVI) focuses on days where the volume has increased from the previous day. The premise is that unsophisticated investors primarily influence the days when the volume is higher. The Negative Volume Index (NVI) focuses on the periods when the volume has decreased from the previous day. The theory is that the "smart money" takes action on these days and can provide a signal of future price movement. On Balance Volume (OBV) is a cumulative indicator that uses volume to predict changes in stock prices. OBV shows crowd sentiment that can eventually translate into price action. The Volume Rate of Change (ROC) is a technical indicator that measures the rate of change in volume over a specified period. It's used to confirm price trends and detect any potential reversals. The Volume Weighted Average Price (VWAP) is an indicator that gives an average price a security has traded at throughout the day, based on both volume and price. It is primarily used by technical analysts to identify market trends. Several charting tools assist traders in understanding the volume of a security. Bar charts, candlestick charts, and volume-over-price are some of the popular charting tools. These tools can depict volume as a histogram at the bottom of the chart, enabling easy visual analysis of volume patterns. Stock screeners are tools that traders and investors use to filter stocks based on specific criteria. For volume analysis, one can use screeners to filter stocks based on factors like high volume change, unusual volume activity, or volume-to-average volume ratios. Several online trading platforms offer sophisticated charting packages with built-in volume indicators. Some of these platforms include MetaTrader, TradingView, and ThinkorSwim. These platforms enable traders to customize and apply various volume indicators for better market analysis. In the stock market, volume analysis is crucial for assessing market sentiment and validating price movements. High trading volumes often accompany significant price changes, making it an essential factor for traders making buy or sell decisions. In the forex market, volume analysis is slightly more complex due to its decentralized nature. Nevertheless, forex traders can utilize tick volume, which is a measure of how often the price ticks up or down. Although not the same as actual trading volume, it can still provide valuable insights into market activity. The cryptocurrency market, being relatively new, is highly volatile. Volume analysis in this market can be highly useful for understanding market sentiment. It can provide indications of potential reversals, and breakouts or validate the strength of ongoing trends. One of the common pitfalls in volume analysis is the misinterpretation of volume data. Traders must be careful not to confuse high volume with bullish sentiment always. High volume can also indicate a potential top or bottom, signifying a price reversal. Volume spoofing refers to a deceptive practice where traders place large buy or sell orders without the intention to execute them, thereby creating false impressions of high volume. Traders need to be aware of this practice as it can lead to misleading signals. While volume indicators can provide useful insights, they are not infallible. They should be used in conjunction with other technical analysis tools for more accurate predictions. For instance, volume indicators can sometimes give contradictory signals, and using them with trend indicators can help confirm the signals. Volume is closely related to liquidity, which is a measure of how quickly a security can be bought or sold without impacting its price. High-volume stocks are typically more liquid, which makes them attractive to traders as they can enter and exit positions with minimal slippage. Market depth refers to a market's ability to sustain relatively large market orders without significantly impacting the price of the security. High volume levels often indicate greater market depth, as they suggest that the security would be able to absorb demand and supply imbalances more efficiently. Volume Spread Analysis (VSA) is a unique approach to understanding volume and price. It looks at the relationship between price spread (range of price) and volume and the subsequent effect this has on future price movement. Traders use VSA to interpret the balance between supply and demand in the market. Volume analysis is a valuable tool that helps measure market trend strength and predict potential reversals. By comprehending the principles of volume analysis and its indicators, traders can anticipate future price movements more accurately. Various tools assist in volume analysis, including charting tools, stock screeners, and advanced trading platforms. Each provides a distinct perspective on trading volume, helping traders gain a thorough understanding of market sentiment and activity. However, it's essential to note that volume analysis should not be used alone but in conjunction with other technical analysis tools and strategies for optimal effectiveness. If unsure how to leverage volume analysis in financial trading, consider consulting a professional wealth management service. They can guide you in applying volume analysis and other strategies for well-informed trading decisions.What Is Volume Analysis?
Understanding Trading Volume
Fundamentals of Volume Analysis
Interpreting Volume Trends
Rising Markets on Increasing Volume
Falling Prices on Increasing Volume
Volume and Price Patterns
Breakouts
Reversals
Key Indicators in Volume Analysis
Positive Volume Index (PVI)
Negative Volume Index (NVI)
On Balance Volume (OBV)
Volume Rate of Change (ROC)
Volume Weighted Average Price (VWAP)
Tools for Volume Analysis
Charting Tools
Stock Screeners
Trading Platforms With Volume Indicators
Volume Analysis in Different Markets
Volume Analysis in Stock Markets
Volume Analysis in Forex Markets
Volume Analysis in Cryptocurrency Markets
Potential Pitfalls and Limitations of Volume Analysis
Misinterpretation of Volume Data
Volume Spoofing
Limitations of Volume Indicators
Advanced Concepts in Volume Analysis
Volume and Liquidity
Volume and Market Depth
Volume Spread Analysis (VSA)
Final Thoughts
Volume Analysis FAQs
Volume analysis is a technical analysis strategy that involves examining the number of shares or contracts of a security that are traded in a given period. It can help traders predict potential price movements based on market activity and sentiment.
Key indicators used in volume analysis include the Positive Volume Index (PVI), Negative Volume Index (NVI), On Balance Volume (OBV), Volume Rate of Change (ROC), and Volume Weighted Average Price (VWAP).
Essential tools for volume analysis include charting tools, stock screeners, and trading platforms with volume indicators. These tools help traders visualize and analyze trading volumes effectively.
Volume analysis is applied across markets to assess market sentiment, validate price movements, and anticipate potential reversals or breakouts. While the approach is generally similar across markets, specific tactics may vary, such as using tick volume in the forex market due to its decentralized nature.
Potential pitfalls include misinterpretation of volume data and deceptive practices like volume spoofing. While volume indicators provide valuable insights, they are not infallible and should be used alongside other technical analysis tools for more accurate predictions.
True Tamplin is a published author, public speaker, CEO of UpDigital, and founder of Finance Strategists.
True is a Certified Educator in Personal Finance (CEPF®), author of The Handy Financial Ratios Guide, a member of the Society for Advancing Business Editing and Writing, contributes to his financial education site, Finance Strategists, and has spoken to various financial communities such as the CFA Institute, as well as university students like his Alma mater, Biola University, where he received a bachelor of science in business and data analytics.
To learn more about True, visit his personal website or view his author profiles on Amazon, Nasdaq and Forbes.


