
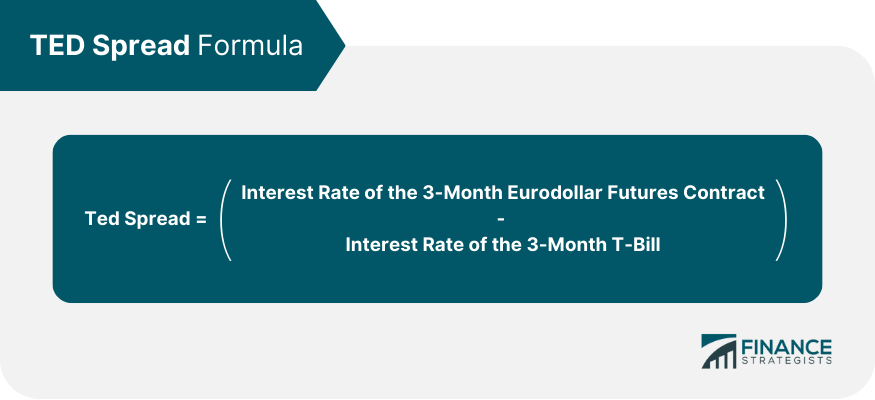
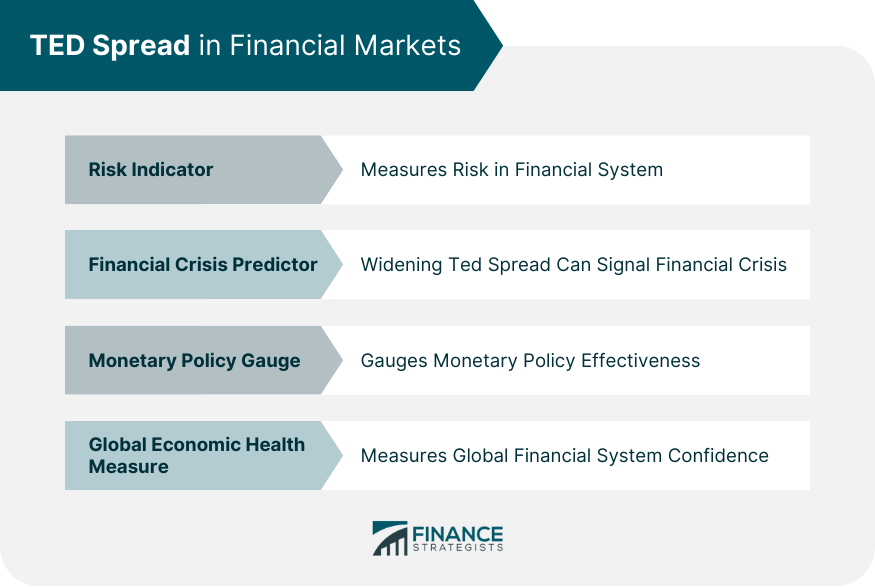
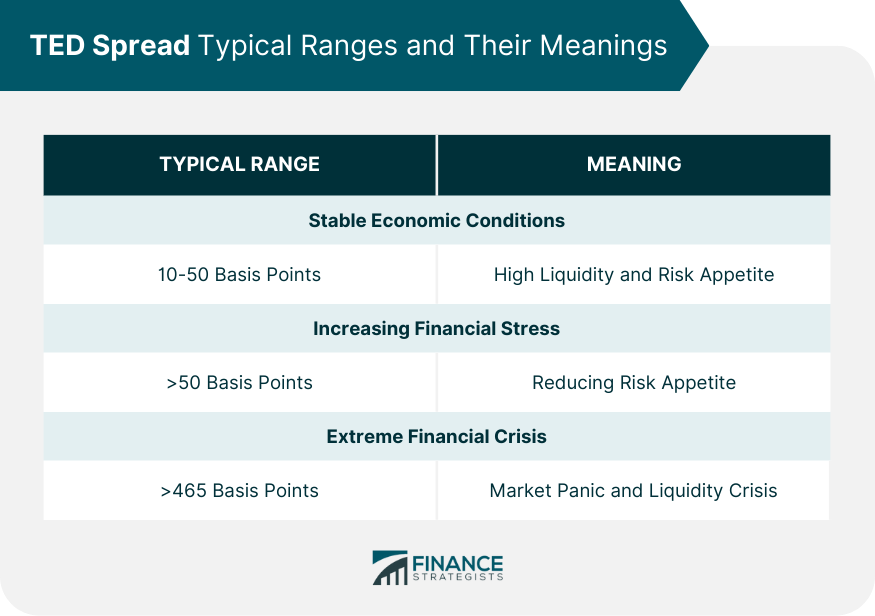
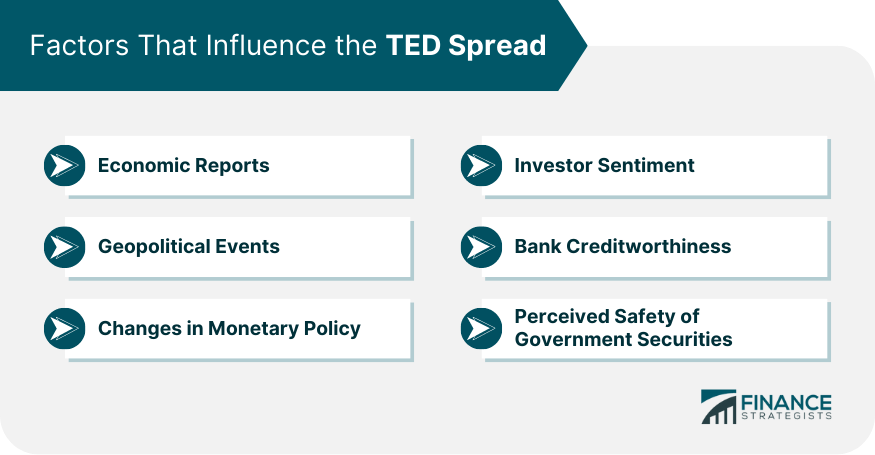
The TED Spread, the disparity between interest rates on interbank loans and short-term US government debt (T-bills), is a reliable gauge of financial market confidence. It mirrors the perceived risk between the 'risk-free' T-bills, underpinned by the US government's credit, and the riskier Eurodollars - US dollar time deposits held outside US banks. A larger TED Spread signals a dip in economic confidence as lenders seek higher returns for heightened risk, whereas a smaller spread indicates stability. Rooted in the 1970s-80s futures contracts markets, the TED Spread is now an esteemed metric for economists and analysts to assess credit risk. As consumers, understanding the TED Spread allows us to make more informed financial decisions, especially during volatile times. It's a key indicator to gauge economic health and predict potential financial crises. Calculating the TED Spread requires two essential inputs – the interest rate for the 3-month T-Bill and the 3-month Eurodollar contract. The T-Bill rate can be obtained from the U.S. Department of the Treasury, and the Eurodollar rate can be found on the Chicago Mercantile Exchange (CME) as part of the futures market. The formula for the TED Spread is relatively simple: This will result in percentage points, typically converted to basis points (1 percentage point = 100 basis points) for ease of discussion and analysis. The TED Spread serves as a crucial barometer of the health and confidence of the financial markets. Its importance can be summarized into three key aspects: The TED Spread represents the difference between a risk-free rate (T-bills) and a riskier rate (interbank loans). A rising spread suggests that lenders perceive an increased risk in the marketplace and demand a higher return, indicating potential financial turbulence. During periods of financial stress or impending crises, the TED Spread tends to widen as banks become more hesitant to lend to one another. This was observed during the 2008 financial crisis when the TED Spread reached record highs. Monitoring the TED Spread can therefore provide early warning signs of financial instability. Central banks often use the TED Spread to indicate monetary policy effectiveness. If the spread remains low following a policy change, the policy instills confidence in the market. Given the global reach of the U.S. dollar and the large scale of the Eurodollar market, the TED Spread provides a snapshot of international confidence in the global financial system. The TED Spread is an invaluable tool for economists, policymakers, traders, and investors, aiding them in assessing market sentiment, spotting potential risks, and making informed decisions. While it might not predict all financial challenges, its rise usually signals increased market stress, serving as a timely reminder to all market participants to brace for potential financial instability. Historically, the TED spread fluctuates between 10 and 50 basis points in stable economic conditions. A spread below this range can suggest a high level of liquidity and risk appetite in the market. In contrast, a spread above 50 basis points can suggest increasing financial stress and reducing risk appetite. During an extreme financial crisis, the TED spread can skyrocket. It reached an all-time high of 465 basis points during the 2008 financial crisis. Many macro and micro factors can affect the TED Spread. These include, but are not limited to: Economic Reports: Economic data such as employment figures, inflation rates, GDP growth, and other key metrics can sway the TED Spread. Strong economic reports often lead to a narrowing of the spread, indicating a healthier economy and lower credit risk. In contrast, weak reports can result in a widening spread, signifying higher perceived credit risk. Geopolitical Events: Geopolitical issues, including wars, political instability, trade disputes, and other international tensions, can significantly impact the spread. Such events can cause uncertainty and volatility in the market, often leading to a broader TED Spread as investors seek refuge in safer assets. Changes in Monetary Policy: Central banks' monetary policies greatly influence the TED Spread. The spread can tighten when central banks lower interest rates or introduce accommodative monetary policies. On the other hand, tightening monetary policy or hiking interest rates can result in a wider spread as the cost of borrowing increases. Investor Sentiment: Investors' overall mood or sentiment can also sway the spread. Bullish sentiment often leads to a narrowing spread as confidence in the market increases and perceived credit risk decreases. Conversely, bearish sentiment can spread wider as market confidence wanes and perceived credit risk rises. Bank Creditworthiness: The perceived creditworthiness of banks can directly impact the TED Spread. If banks are seen as more likely to default on their obligations, the spread can widen as the perceived risk of lending to banks increases. The spread can narrow if banks are viewed as more creditworthy. Perceived Safety of Government Securities: The perceived safety of government securities relative to other investments can influence the TED Spread. If investors view government securities as safer during uncertain times, demand for them increases, lowering their yield and widening the TED Spread. Anything that affects the perceived risk associated with lending to banks or the relative safety of government securities can cause fluctuations in the TED Spread. Understanding these factors can help investors navigate the financial markets more effectively. The TED Spread can be used as a forecasting tool for future economic downturns. An increasing TED Spread may signal growing concern about the default risk, indicative of an approaching recession. For instance, ahead of the 2008 financial crisis, the TED Spread showed a sharp increase, flagging rising tensions in the financial markets. While the TED Spread can be an early warning system, it is not infallible. Like any economic indicator, it should be used in conjunction with other market signals and economic data. Furthermore, the spread is based on current market conditions, which can be influenced by a wide range of factors and can change rapidly. It reflects market sentiment about future credit risk but doesn't predict specific events. The TED Spread can influence financial decision-making in several ways: Investment Decisions: Investors can use the TED Spread to gauge the level of risk in the market. A high TED Spread can signal increased perceived risk, which might prompt conservative investors to switch to safer assets or diversify their portfolios. A low spread might indicate a more favorable environment for riskier investments. Corporate Financing Decisions: Companies looking to raise capital monitor the TED Spread to time their financing activities. A high TED Spread could mean a higher borrowing cost, which might cause companies to delay issuing debt or seek alternative financing methods. Risk Management: Financial institutions can use the TED Spread as an indicator of market stress, adjusting their risk management strategies accordingly. For example, during periods of high TED Spread, banks might become more conservative in their lending practices to mitigate potential losses. Monetary Policy Decisions: Central banks might use the TED Spread to assess the effectiveness of their policies. If the spread widens after a policy shift aimed at instilling confidence, it could indicate that the policy change does not have the desired effect, prompting a reconsideration of the strategy. Trading Strategies: In the derivatives market, traders might use the TED Spread to identify arbitrage opportunities or hedge against potential risks. The LIBOR-OIS Spread is another significant indicator of credit risk in the banking sector. It measures the difference between the London Interbank Offered Rate (LIBOR) and the Overnight Indexed Swap (OIS) rate. While the TED Spread considers the risk differential between interbank loans and risk-free government securities, the LIBOR-OIS Spread reflects the term risk premium in the interbank market. Both spreads tend to move in tandem but occasionally diverge due to specific market conditions. The yield curve, which plots the interest rates of bonds with equal credit quality but differing maturity dates, is another crucial market indicator. An inverted yield curve, where short-term rates exceed long-term rates, has historically been a reliable predictor of recessions. Analysts can better understand market sentiment and economic conditions by comparing the TED Spread with the yield curve. The TED Spread is an invaluable measure of credit risk and economic health. It's the difference between the interest rates on interbank loans and short-term U.S. government debt, with larger spreads indicating greater credit risk and economic instability. From serving as an indicator of financial stress during the 2008 Global Financial Crisis to its role in risk management and investment strategy, the TED Spread continues to be a vital tool for investors and economists alike. As financial markets evolve, the importance of monitoring indicators like the TED Spread only grows. It will remain a key part of financial studies and practices, helping to guide decision-making in an increasingly complex financial landscape. As an investor, understanding and monitoring the TED Spread can aid in managing your portfolio effectively. Consulting with a financial advisor or wealth manager who understands these concepts can help align your investment strategy with current market conditions.What Is the TED Spread?
Calculation of TED Spread
Components: Treasury Bill Rates and Eurodollar Rates
Mathematical Formula
TED Spread in Financial Markets
Risk Indicator
Financial Crisis Predictor
Monetary Policy Gauge
Global Economic Health Measure
Interpretation of TED Spread
Typical Ranges and Their Meanings
Factors That Influence the Spread
TED Spread as a Forecasting Tool
Predicting Recessions
Caveats and Limitations
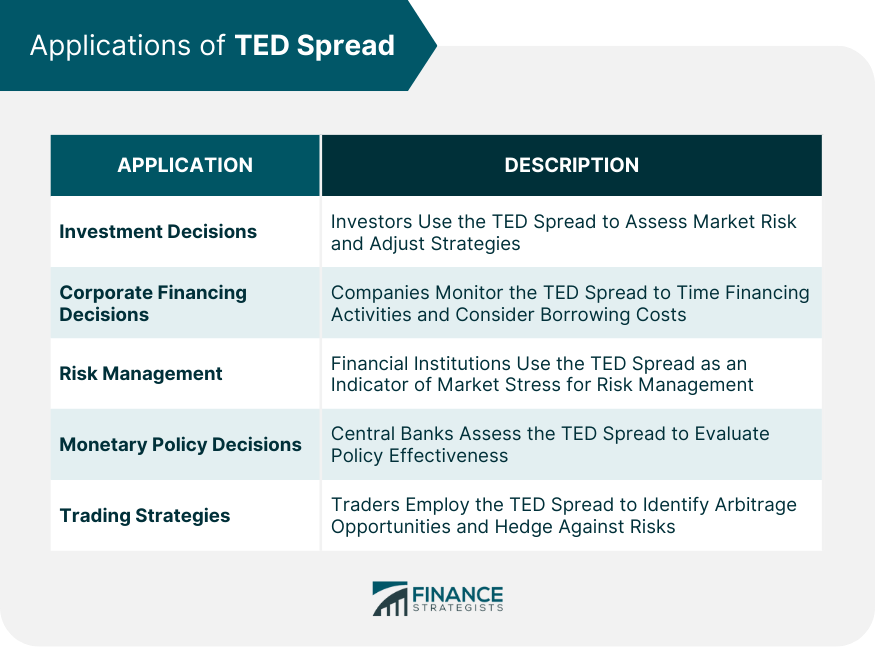
Applications of TED Spread in Financial Decision Making
Comparison of TED Spread With Other Market Indicators
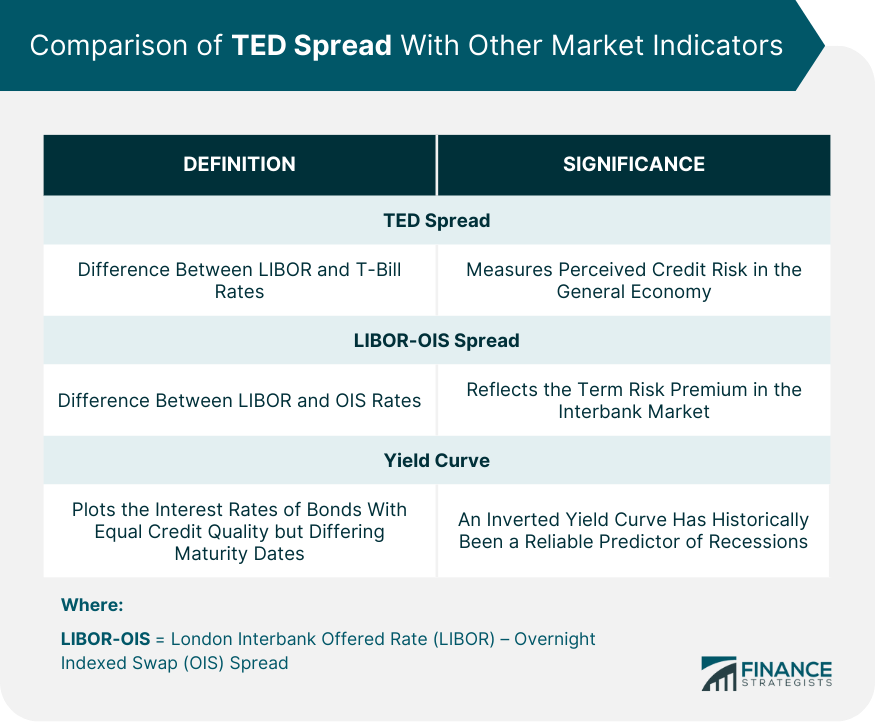
LIBOR-OIS Spread
Yield Curve
Conclusion
TED Spread FAQs
The TED Spread is a significant indicator of credit risk and overall economic health. A higher TED Spread generally indicates greater perceived credit risk in the economy, whereas a lower spread suggests less credit risk and more financial stability.
The TED Spread is calculated as the difference between the interest rate on a 3-month Eurodollar futures contract and a 3-month U.S. Treasury bill. The result is usually expressed in basis points (bps).
The TED Spread spiked dramatically during the 2008 financial crisis, reaching an all-time high of 465 basis points. This was due to a sharp increase in perceived credit risk as banks became more hesitant to lend to each other.
The TED Spread can serve as a forecasting tool for economic downturns, as it reflects the financial system's credit risk level. However, using it in conjunction with other economic indicators is important for more accurate forecasting.
The TED Spread can guide investment strategy. A lower spread may suggest a good time to invest in riskier assets, while a higher spread may suggest a shift towards safer investments. It's crucial to continuously monitor the TED Spread and other market indicators to make informed investment decisions.
True Tamplin is a published author, public speaker, CEO of UpDigital, and founder of Finance Strategists.
True is a Certified Educator in Personal Finance (CEPF®), author of The Handy Financial Ratios Guide, a member of the Society for Advancing Business Editing and Writing, contributes to his financial education site, Finance Strategists, and has spoken to various financial communities such as the CFA Institute, as well as university students like his Alma mater, Biola University, where he received a bachelor of science in business and data analytics.
To learn more about True, visit his personal website or view his author profiles on Amazon, Nasdaq and Forbes.


