
Symmetrical distribution, also known as a normal distribution or bell curve, is a statistical concept used in wealth management. It is a probability distribution where the data is evenly distributed around a central value, creating a symmetrical pattern. Symmetrical distribution serves as a foundational assumption for statistical models and analysis techniques, providing valuable insights for making informed decisions regarding risk management, asset allocation, and portfolio optimization. Many financial variables, including stock returns, asset prices, and portfolio performance, tend to exhibit a roughly symmetrical distribution. This helps wealth managers assess risks, and develop effective asset allocation strategies. Symmetrical distribution simplifies statistical analysis by offering a predictable framework for modeling and assessing financial data. It enhances the accuracy and robustness of decision-making in wealth management practices. Symmetrical distribution is characterized by its bell-shaped curve, where the mean, median, and mode are all located at the center of the distribution. The distribution is perfectly symmetrical, meaning that the data points are equally distributed around the central value, creating a balanced pattern. Symmetrical distribution is used to describe the behavior and characteristics of financial variables such as investment returns, asset prices, and portfolio performance. It helps investors understand the central tendency, dispersion, and overall shape of the data, which are crucial for risk assessment, asset allocation strategies, and portfolio optimization. Symmetrical distribution exhibits a central tendency, where the mean, median, and mode are all located at the center of the distribution. This indicates that the data is evenly distributed around the central value, with an equal number of data points on either side. Skewness measures the symmetry or asymmetry of a distribution. In a symmetrical distribution, the skewness is zero, indicating perfect symmetry. The absence of skewness in symmetrical distribution implies that there are no significant deviations from the central value in either direction. Kurtosis measures the peakedness or flatness of a distribution compared to the normal distribution. In a symmetrical distribution, the kurtosis is typically close to zero, indicating a similar degree of peakedness or flatness as the normal distribution. The mean is a measure of central tendency that calculates the average value of a set of data. In a symmetrical distribution, the mean is located at the center of the distribution, representing the balance point. The median is another measure of central tendency that represents the middle value of a set of data. In a symmetrical distribution, the median coincides with the mean, as both are located at the center of the distribution. The mode is the most frequently occurring value in a dataset. In a symmetrical distribution, the mode is also located at the center of the distribution, coinciding with the mean and median. The range measures the spread of data in a distribution. It is calculated by subtracting the minimum value from the maximum value. In a symmetrical distribution, the range extends symmetrically on either side of the central value. Variance measures the average squared deviation from the mean in a dataset. In a symmetrical distribution, the variance is evenly distributed around the mean, indicating balanced dispersion of data. The standard deviation is the square root of the variance and provides a measure of the spread of data. In a symmetrical distribution, the standard deviation is symmetrically distributed around the mean, reflecting the balanced dispersion of data. By assuming a symmetrical distribution, wealth managers can estimate the likelihood of extreme events and calculate risk metrics such as value at risk (VaR) and expected shortfall. These metrics help in determining the potential downside risk and tail events, allowing for effective risk allocation and mitigation strategies. By assuming symmetrical distribution for asset returns, wealth managers can estimate expected returns and assess the risk associated with different asset classes. This information is crucial in constructing well-diversified portfolios that aim to optimize risk and return. Symmetrical distribution plays a role in portfolio optimization techniques such as mean-variance analysis. By assuming symmetrical distribution for asset returns, wealth managers can construct efficient frontiers that maximize expected return for a given level of risk. This allows for the selection of optimal portfolio combinations that align with investors' risk preferences and return objectives. When analyzing investment returns, such as stock or bond returns, a symmetrical distribution is often assumed. This assumption allows wealth managers to estimate the average return, volatility, and downside risk associated with the investment. It helps in evaluating the potential outcomes and making informed investment decisions. Symmetrical distribution is frequently observed in the distribution of asset prices. The assumption of symmetrical distribution aids in estimating expected prices, assessing the likelihood of price movements, and implementing trading strategies based on technical analysis techniques. By assuming a symmetrical distribution for asset returns, wealth managers can identify uncorrelated or negatively correlated assets to construct well-diversified portfolios. This helps in reducing portfolio risk and increasing the potential for stable returns. Symmetrical distribution provides a predictable framework for statistical analysis, making it easier to model and interpret financial data accurately. It simplifies calculations and allows for the application of various statistical techniques, enhancing the effectiveness of wealth management strategies. Symmetrical distribution serves as a baseline assumption for risk assessment and allocation. By assuming a symmetrical distribution, wealth managers can estimate the likelihood of extreme events and develop risk management strategies that align with investors' risk tolerance. While symmetrical distribution is a useful assumption in many cases, real-world data often exhibits deviations from perfect symmetry. Financial markets are influenced by various factors, resulting in skewed or non-normal distributions. It is important to consider the limitations of symmetrical distribution and adjust analysis techniques accordingly. Symmetrical distribution assumes that outliers are rare or nonexistent. However, in financial markets, extreme events and outliers can occur, impacting the distribution's symmetry. It is crucial to consider the potential impact of outliers on risk and return estimates, as they may significantly affect wealth management decisions. Symmetrical distribution is a statistical concept widely used in wealth management. It refers to a probability distribution where data is evenly distributed around a central value, creating a symmetrical pattern. It provides insights into risk assessment and allocation, asset allocation strategies, and portfolio optimization. By assuming symmetrical distribution, wealth managers can estimate expected returns, assess the likelihood of extreme events, and construct diversified portfolios. Symmetrical distribution simplifies statistical analysis by providing a predictable framework for modeling financial data. It serves as a baseline assumption for risk management, allowing wealth managers to estimate potential downside risk and tail events. Although valuable in wealth management, symmetrical distribution has limitations as it may not accurately capture outliers or account for skewness and kurtosis. Nonetheless, while deviations from a symmetrical pattern can occur, assuming a symmetrical distribution allows for informed decision-making and better understanding of the potential risks and rewards associated with investments. By utilizing the principles derived from symmetrical distribution, investors and financial professionals can navigate the complexities of wealth management more efficiently, ultimately working towards achieving their financial goals.Definition of Symmetrical Distribution
How a Symmetrical Distribution Works
Characteristics of Symmetrical Distributions
Central Tendency
Skewness
Kurtosis
Measures of Central Tendency in Symmetrical Distributions
Mean
Median
Mode
Measures of Dispersion in Symmetrical Distributions
Range
Variance
Standard Deviation
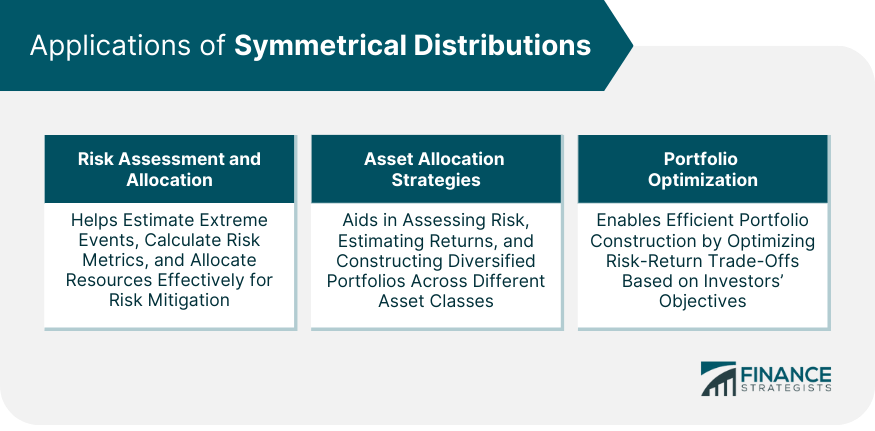
Applications of Symmetrical Distributions
Risk Assessment and Allocation
Asset Allocation Strategies
Portfolio Optimization
Examples of Symmetrical Distributions in Wealth Management
Investment Returns
Asset Prices
Portfolio Diversification
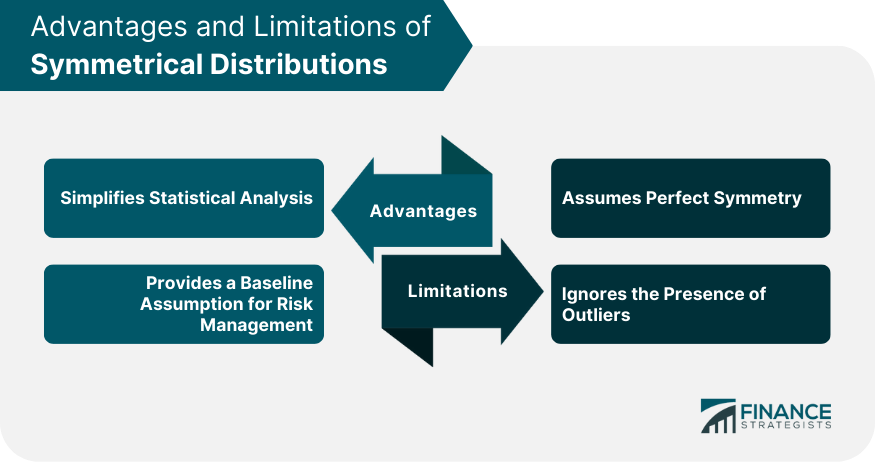
Advantages of Symmetrical Distributions
Simplifies Statistical Analysis
Provides a Baseline Assumption for Risk Management
Limitations of Symmetrical Distributions
Assumes Perfect Symmetry
Ignores the Presence of Outliers
Conclusion
Symmetrical Distribution FAQs
Symmetrical distribution, also known as a normal distribution or bell curve, is a probability distribution where data is evenly distributed around a central value. It is commonly used in wealth management for statistical analysis, risk assessment, and portfolio optimization.
Symmetrical distribution has various applications in wealth management. It is used for risk assessment and allocation, asset allocation strategies, and portfolio optimization. It helps in estimating expected returns, evaluating the likelihood of extreme events, and constructing well-diversified portfolios.
Understanding symmetrical distribution is important as it provides a baseline assumption for statistical analysis. It simplifies modeling and interpretation of financial data, allowing wealth managers to make informed decisions. It aids in risk management by estimating potential downside risk and helps in constructing optimized portfolios.
Symmetrical distribution simplifies statistical analysis, providing a predictable framework for modeling financial data. It helps in estimating risk parameters, evaluating expected returns, and developing diversified portfolios. It enhances the effectiveness of wealth management strategies.
Symmetrical distribution assumes perfect symmetry, which may not always hold in practice. Real-world data often exhibits deviations from perfect symmetry, and financial markets can experience extreme events and outliers. It is important to consider these limitations and adjust analysis techniques accordingly.
True Tamplin is a published author, public speaker, CEO of UpDigital, and founder of Finance Strategists.
True is a Certified Educator in Personal Finance (CEPF®), author of The Handy Financial Ratios Guide, a member of the Society for Advancing Business Editing and Writing, contributes to his financial education site, Finance Strategists, and has spoken to various financial communities such as the CFA Institute, as well as university students like his Alma mater, Biola University, where he received a bachelor of science in business and data analytics.
To learn more about True, visit his personal website or view his author profiles on Amazon, Nasdaq and Forbes.


