
Skewness is a measure of the asymmetry of a distribution. It is an essential concept in finance, as it helps analysts understand the shape of a dataset and its potential implications. Skewness is crucial in financial analysis because it provides insight into the distribution of returns and risks associated with various investments. Understanding skewness can help investors make more informed decisions regarding their portfolios. There are three primary types of skewness: positively skewed, negatively skewed, and symmetrical distribution. Each type has different characteristics and implications for financial analysis. Pearson's first coefficient of skewness, also known as the mode skewness, is a measure of skewness that compares the mode and mean of a distribution. It provides an indication of the direction and magnitude of a distribution's asymmetry. Pearson's second coefficient of skewness, or the median skewness, compares the median and mean of a distribution. It is another way to quantify a distribution's asymmetry and provides information about its shape. Bowley's coefficient of skewness is a measure of skewness that compares the differences between the quartiles of a distribution. This measure is less sensitive to outliers and provides a more robust estimation of skewness. Kelly's coefficient of skewness is a measure that compares the tails of a distribution to assess its asymmetry. It is particularly useful for understanding the riskiness of investments with extreme outcomes. A positively skewed distribution has a long tail on the right side, indicating that most of the values are concentrated on the lower end. This type of distribution is also known as right-skewed. Examples of positively skewed distributions in finance include stock returns during a bull market or the income distribution of a population, where most people have lower incomes and a few have higher incomes. Positively skewed distributions may indicate higher potential returns but also higher risks, as there is a greater likelihood of extremely positive outcomes. A negatively skewed distribution has a long tail on the left side, indicating that most of the values are concentrated on the upper end. This type of distribution is also known as left-skewed. Examples of negatively skewed distributions in finance include stock returns during a bear market or the distribution of insurance claims, where most claims are small, and a few are large. Negatively skewed distributions may indicate lower potential returns but also lower risks, as there is a greater likelihood of extremely negative outcomes. A symmetrical distribution has equal tails on both sides, indicating that the values are evenly distributed around the mean. This type of distribution has no skewness. Examples of symmetrical distributions in finance include the returns of a well-diversified portfolio or the distribution of credit scores in a population. Symmetrical distributions may indicate a balance between potential returns and risks, as there is an equal likelihood of positive and negative outcomes. This type of distribution is often considered more desirable in financial analysis because it suggests a more predictable pattern of returns and risks. A normal distribution is symmetrical with no skewness, where the mean, median, and mode are equal. On the other hand, skewness measures the degree of asymmetry in a distribution, which can help identify deviations from normality. Skewness can have significant implications for financial analysis that rely on the assumptions of normal distribution. When a distribution is skewed, it can lead to inaccurate risk assessments and incorrect conclusions about potential investment returns. Several transformation techniques can be applied to reduce skewness in financial data and make it more suitable for analysis based on normal distribution assumptions. Common methods include log transformation, square root transformation, and Box-Cox transformation, which help normalize the data and minimize the impact of skewness. A histogram is a graphical representation of the distribution of a dataset, which can be used to assess skewness visually. By examining the shape of the histogram, analysts can identify any asymmetry in the data. A box plot is another graphical method used to detect skewness in financial data. It displays the distribution of a dataset through its quartiles, allowing analysts to identify potential skewness by observing any asymmetry in the box plot. A Q-Q plot compares the quantiles of a dataset to those of a normal distribution, helping to identify any deviations from normality. Skewness can be detected by observing any systematic deviations from the straight line in the Q-Q plot. The skewness coefficient is a numerical measure of skewness that quantifies the degree of asymmetry in a distribution. A positive skewness coefficient indicates a positively skewed distribution, a negative skewness coefficient indicates a negatively skewed distribution, and a coefficient close to zero suggests a symmetrical distribution. Comparing the standard deviation and mean of a dataset can provide insight into the potential skewness of the distribution. If the standard deviation is significantly larger than the mean, it may indicate a positively skewed distribution, while a smaller standard deviation relative to the mean may suggest a negatively skewed distribution. Kurtosis measures the "tailedness" of a distribution, which can help identify skewness in financial data. High kurtosis values indicate a more extreme distribution with heavier tails, while low kurtosis values suggest a more moderate distribution with lighter tails. By examining kurtosis in conjunction with other measures of skewness, analysts can better understand a dataset's shape and risk characteristics. Skewness plays a crucial role in assessing the risk associated with investments in a portfolio. Understanding the distribution of returns can help investors identify potential risks and make better-informed decisions about their investments. Diversification is a key strategy for managing risk in a portfolio. By considering the skewness of individual assets, investors can design a more balanced and diversified portfolio that minimizes exposure to extreme outcomes. Evaluating the performance of a portfolio requires an understanding of skewness. A skewed distribution of returns can provide insights into a portfolio's overall performance and risk, allowing investors to make adjustments as needed. Skewness can have a significant impact on option pricing models. Option pricing models can provide more accurate estimates of option values and risk parameters by accounting for skewness in the underlying asset's distribution. Implied volatility is a measure of market expectations regarding future price movements. Skewness can influence implied volatility, as it reflects the likelihood of extreme price movements, which can affect the pricing of options. Analyzing skewness in stock returns can provide valuable insights into market conditions and potential risks. A higher degree of skewness in stock returns may indicate increased market volatility and potential investor opportunities. Market sentiment can influence the skewness of asset returns. During periods of optimism, asset returns may exhibit positive skewness, while negative skewness may be more prevalent during pessimistic market conditions. Investors may exhibit preferences for skewness, which can impact their investment decisions. Some investors may prefer positively skewed investments, while others may be more inclined to invest in negatively skewed assets. Skewness can affect investor decision-making by influencing perceptions of risk and potential returns. Investors may make different choices based on the skewness of investment outcomes, which can have implications for their overall investment strategies. When analyzing skewness, it is essential to consider the sample size. Small sample sizes can lead to unreliable skewness estimates, which may not accurately reflect the true distribution of the data. Outliers can significantly impact skewness estimates, potentially leading to incorrect conclusions about the distribution of financial data. Analysts should be cautious when interpreting skewness in the presence of outliers and consider robust measures of skewness when appropriate. Skewness coefficients can sometimes be misinterpreted, leading to inaccurate conclusions about the distribution of financial data. It is essential to understand the limitations of skewness coefficients and interpret them in the context of other measures of distribution shape, such as kurtosis. Skewness is an essential concept in finance that measures the asymmetry of a distribution. It plays a crucial role in various aspects of finance, including portfolio management, option pricing, market analysis, and behavioral finance. Understanding skewness is vital for accurate financial analysis, as it can provide insights into the risks and potential returns associated with investments. Investors and analysts can make more informed decisions and better manage their portfolios by considering skewness. Given the importance of understanding skewness in finance and its impact on investment decisions, it is crucial to seek the guidance of professional wealth management services. These experts can help you navigate the complexities of skewness and other financial concepts, ensuring that your investment strategies are well-informed and tailored to your unique financial goals. By leveraging the expertise of wealth management professionals, you can better manage risks and maximize the potential returns of your investments.What Is Skewness?
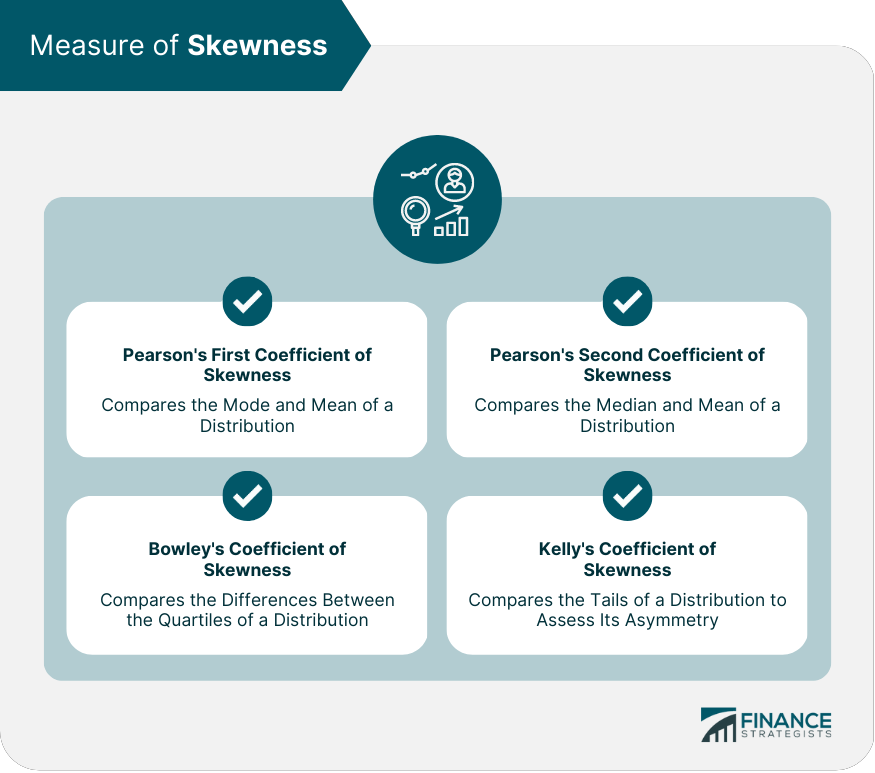
Measures of Skewness
Pearson's First Coefficient of Skewness
Pearson's Second Coefficient of Skewness
Bowley's Coefficient of Skewness
Kelly's Coefficient of Skewness
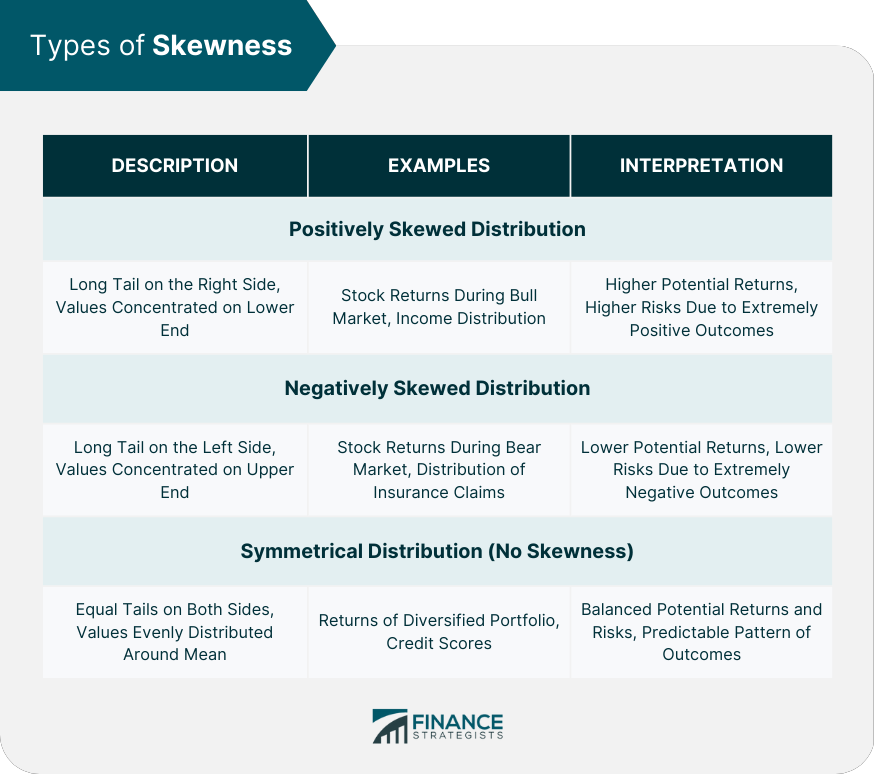
Types of Skewness
Positively Skewed Distribution
Negatively Skewed Distribution
Symmetrical Distribution (No Skewness)
Skewness and Normal Distribution
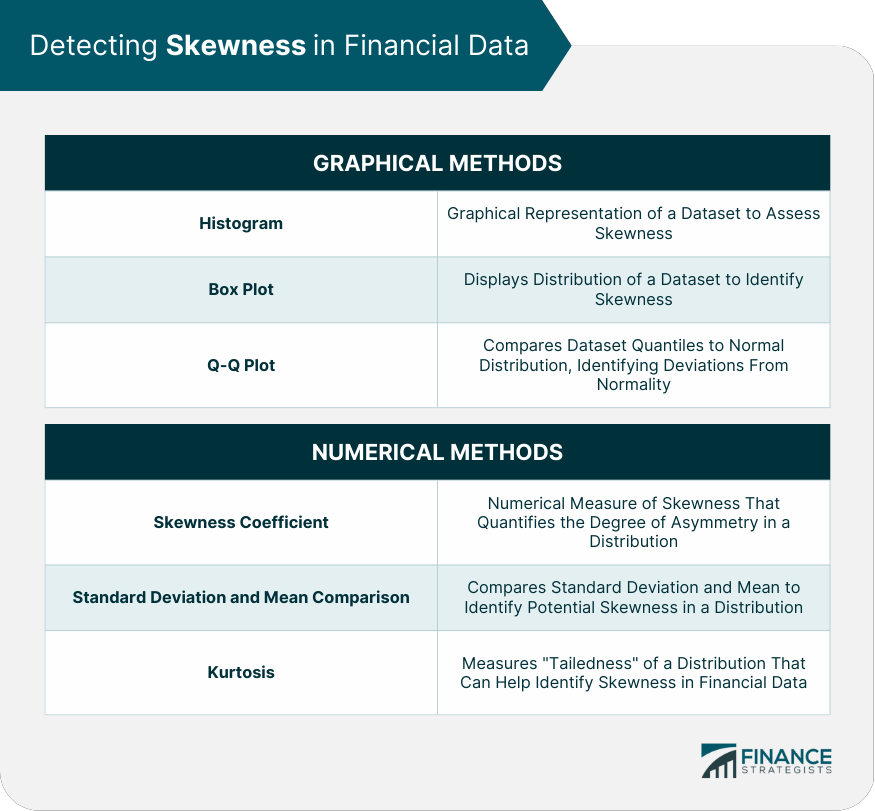
Detecting Skewness in Financial Data
Graphical Methods
Histogram
Box Plot
Q-Q Plot
Numerical Methods
Skewness Coefficient
Standard Deviation and Mean Comparison
Kurtosis
Applications of Skewness in Finance
Portfolio Management
Risk Assessment
Diversification Strategies
Performance Evaluation
Option Pricing
Impact of Skewness on Option Pricing Models
Skewness and Implied Volatility
Market Analysis
Skewness in Stock Returns
Market Sentiment and Skewness
Behavioral Finance
Skewness Preference Among Investors
Impact of Skewness on Decision-Making
Limitations and Misinterpretations of Skewness
Sample Size Considerations
Outliers and Their Impact on Skewness in Financial Data
Misinterpretation of Skewness Coefficients
Final Thoughts
Skewness FAQs
Skewness is a measure of the asymmetry of a distribution, and it is crucial in finance because it provides insights into the distribution of returns and risks associated with various investments, helping investors make informed decisions about their portfolios.
Skewness can be used in portfolio management for risk assessment, designing diversification strategies, and evaluating the performance of a portfolio. By understanding the skewness of individual assets, investors can create a balanced and diversified portfolio that minimizes exposure to extreme outcomes.
Skewness can have a significant impact on option pricing models, as it affects the distribution of the underlying asset's returns. Accounting for skewness in option pricing models can result in more accurate estimates of option values and risk parameters, as well as influence implied volatility.
Skewness can affect investor decision-making by influencing perceptions of risk and potential returns. Investors may exhibit preferences for positively or negatively skewed investments, which can impact their overall investment strategies and choices based on the skewness of investment outcomes.
Limitations of using skewness in the financial analysis include sample size considerations, the impact of outliers on skewness estimates, and the potential misinterpretation of skewness coefficients. To overcome these limitations, analysts should consider the context of other distribution measures and use robust skewness measures when appropriate.
True Tamplin is a published author, public speaker, CEO of UpDigital, and founder of Finance Strategists.
True is a Certified Educator in Personal Finance (CEPF®), author of The Handy Financial Ratios Guide, a member of the Society for Advancing Business Editing and Writing, contributes to his financial education site, Finance Strategists, and has spoken to various financial communities such as the CFA Institute, as well as university students like his Alma mater, Biola University, where he received a bachelor of science in business and data analytics.
To learn more about True, visit his personal website or view his author profiles on Amazon, Nasdaq and Forbes.


