
The bearish engulfing pattern is a crucial technical analysis tool used in predicting a forthcoming reversal of a bullish trend in the market. It consists of two candlesticks: a smaller bullish candle followed by a larger bearish one, signifying a potential shift in market sentiment from buying to selling. The bearish engulfing pattern is highly valued by traders and analysts for its predictive power. Its occurrence alerts traders to an impending bearish trend, allowing them to make informed decisions about exiting long positions or entering short ones. Understanding and accurately identifying this pattern can, therefore, be the key to effective risk management and profitable trading. Price action, the movement of a security's price over time, is central to identifying a bearish engulfing pattern. Traders must understand the market context in which this pattern appears, focusing on preceding price movements, especially the trend, before the pattern emerges. The bearish engulfing pattern consists of two crucial components: a smaller bullish candle followed by a larger bearish candle. The bullish candle represents the continuation of the preceding uptrend, while the bearish candle signals a potential reversal, completely engulfing or overshadowing the prior bullish candle. While the basic structure is important, several conditions must be met for a bearish engulfing pattern. The pattern typically appears after a notable uptrend, providing a context of preceding bullish sentiment. Furthermore, the bearish candle should open above the previous candle's close and close below its opening, creating an engulfing effect. Before a bearish engulfing pattern can form, there must be an existing bullish trend. The strength of this trend can impact the significance of the pattern, with stronger trends suggesting a more potent reversal signal. The first candle in the pattern is bullish, representing an extension of the preceding uptrend. It's usually smaller, with its body fully contained within the range of the following candle. The second candle, the bearish one, engulfs the body of the first. It opens above the first candle's close and ends below its opening. This candle shows a shift from buyers' dominance to sellers taking control. Often, the bearish engulfing pattern is accompanied by increasing volume during the formation of the second (bearish) candle. This higher trading volume provides further confirmation of the impending bearish reversal. A bearish engulfing pattern is primarily seen as a reversal signal, suggesting an imminent shift from a bullish to a bearish market. Its appearance might trigger a selling spree as traders anticipate a downward trend. By identifying this pattern, traders can anticipate a possible decline in prices and plan their trades accordingly. However, while the bearish engulfing pattern can provide a signal for future price movements, it should be used in conjunction with other technical indicators for more accurate predictions. The bearish engulfing pattern also assists in determining potential risk and reward parameters. The top of the bearish candle can be used to set a stop loss for short trades, while the pattern's low can be a target for taking profits. Once a bearish engulfing pattern is identified, traders can prepare to enter a short position. Before doing so, they should ensure the pattern is not a false signal and consider other technical indicators. The ideal entry point is usually the opening of the next candle following the bearish engulfing pattern. This allows traders to confirm the pattern and avoid premature entries. Setting a stop loss is crucial in managing potential risks. A stop loss can be placed above the high of the bearish engulfing candle to limit potential losses should the market move in an unexpected direction. Setting a take-profit level can help secure profits before the market reverses. This could be set at a significant support level or based on a risk-reward ratio that the trader is comfortable with. The bullish engulfing pattern is the direct opposite of the bearish engulfing pattern. It consists of a smaller bearish candle followed by a larger bullish candle, indicating a potential shift from a bearish to a bullish market. The dark cloud cover is another bearish reversal pattern, but it differs slightly. It consists of a long bullish candle followed by a bearish candle that opens at a new high and closes below the midpoint of the first candle's body. The piercing line pattern is a bullish reversal pattern consisting of a long bearish candle followed by a bullish candle that opens at a new low and closes above the midpoint of the first candle's body. Both the hammer and the hanging man are single candlestick patterns. The hammer is a bullish reversal pattern, while the hanging man can be a bearish reversal pattern, but both depend heavily on the following candle or market context for confirmation. Like any other technical pattern, the bearish engulfing pattern is not foolproof and can provide false signals. Traders should be cautious when interpreting this pattern and always seek confirmation from subsequent candles or other technical analysis tools. During periods of high market volatility, the bearish engulfing pattern may appear more frequently, increasing the risk of false signals. Traders must therefore consider overall market conditions when interpreting these patterns. The bearish engulfing pattern should not be used in isolation. Combining it with other forms of technical analysis, such as trend lines, moving averages, or momentum indicators, can enhance its reliability and accuracy. The bullish engulfing pattern is the direct opposite of the bearish engulfing pattern. It consists of a smaller bearish candle followed by a larger bullish candle, indicating a potential shift from a bearish to a bullish market. The dark cloud cover is another bearish reversal pattern, but it differs slightly. It consists of a long bullish candle followed by a bearish candle that opens at a new high and closes below the midpoint of the first candle's body. The piercing line pattern is a bullish reversal pattern consisting of a long bearish candle followed by a bullish candle that opens at a new low and closes above the midpoint of the first candle's body. Both the hammer and the hanging man are single candlestick patterns. The hammer is a bullish reversal pattern, while the hanging man can be a bearish reversal pattern, but both depend heavily on the following candle or market context for confirmation. Like any other technical pattern, the bearish engulfing pattern is not foolproof and can provide false signals. Traders should be cautious when interpreting this pattern and always seek confirmation from subsequent candles or other technical analysis tools. During periods of high market volatility, the bearish engulfing pattern may appear more frequently, increasing the risk of false signals. Traders must therefore consider overall market conditions when interpreting these patterns. The bearish engulfing pattern should not be used in isolation. Combining it with other forms of technical analysis, such as trend lines, moving averages, or momentum indicators, can enhance its reliability and accuracy. Pairing the bearish engulfing pattern with other technical indicators like the Relative Strength Index (RSI) or Moving Average Convergence Divergence (MACD) can enhance its predictive power. For example, an overbought RSI reading combined with a bearish engulfing pattern can be a strong sell signal. While technical analysis focuses on price action and patterns, fundamental analysis considers economic, financial, and other qualitative factors. Combining these two methods can provide a more comprehensive view of the market and enhance trading decisions. The bearish engulfing pattern can be a valuable tool within a trader's comprehensive plan, providing insights into potential market reversals. However, it should be used in conjunction with risk management strategies, appropriate leverage, and disciplined execution. The Bearish Engulfing Pattern is a significant tool for predicting potential reversals from a bullish to a bearish market trend. It comprises a smaller bullish candlestick followed by a larger bearish one, which completely overshadows or 'engulfs' the first. Key elements include a preceding bullish trend, identification of the candlestick features, and understanding the pattern's significance, such as it acts as a reversal indicator. In trading, setting up a trade, timing the entry point, placing a stop loss, and establishing a take profit level are crucial steps to consider. Furthermore, one must be vigilant of false signals and supplement the analysis with other technical indicators for accuracy. Lastly, while this guide provides a robust introduction to the Bearish Engulfing Pattern, navigating the complexities of financial markets can be challenging. Therefore, seeking professional services or guidance is highly recommended to ensure informed and strategic trading decisions.What Is a Bearish Engulfing Pattern?
Identifying a Bearish Engulfing Pattern
Understanding Price Action
Identifying Key Candlestick Features
Special Conditions for Pattern Recognition
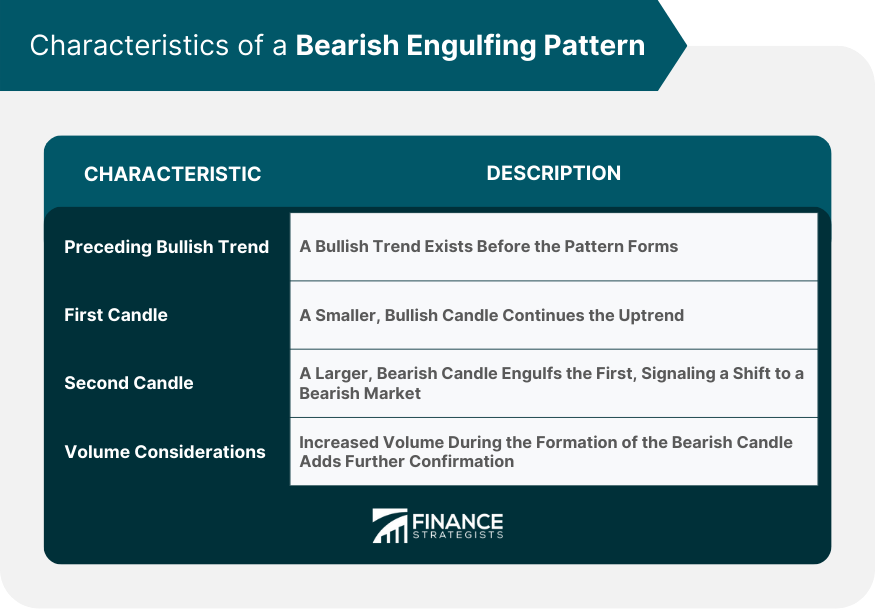
Characteristics of a Bearish Engulfing Pattern
Preceding Bullish Trend
First Candle: Bullish and Smaller
Second Candle: Bearish and Engulfing
Volume Considerations
Significance of a Bearish Engulfing Pattern
Reversal Indicator
Predicting Future Price Movements
Risk and Reward Factors
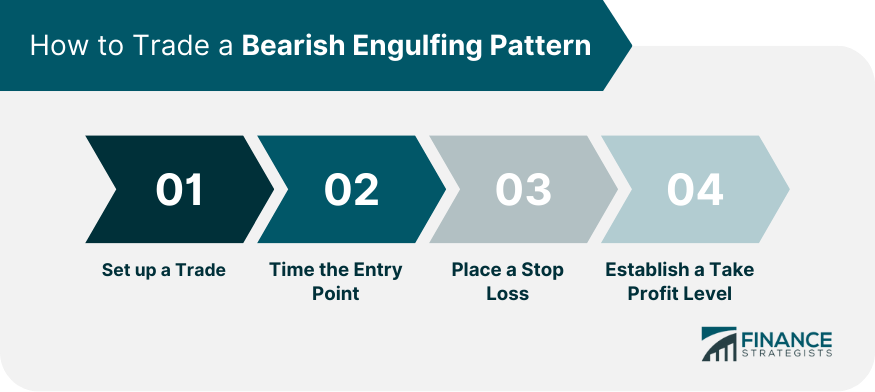
How to Trade a Bearish Engulfing Pattern
Setting up a Trade
Timing the Entry Point
Placing a Stop Loss
Establishing a Take-Profit Level
Bearish Engulfing Pattern vs Other Candlestick Patterns
Bullish Engulfing Pattern
Dark Cloud Cover
Piercing Line Pattern
Hammer and Hanging Man Patterns
Limitations and False Signals of Bearish Engulfing Patterns
Recognizing False Signals
Understanding Market Volatility
Importance of Supplemental Technical Analysis
Advanced Trading Strategies Using Bearish Engulfing Patterns
Pairing With Other Technical Indicators
Combining With Fundamental Analysis
Incorporating Into a Comprehensive Trading Plan
Final Thoughts
Bearish Engulfing Pattern FAQs
The bearish engulfing pattern is a candlestick pattern that signals a potential reversal from bullish to bearish market sentiment. It consists of a smaller bullish candle followed by a larger bearish candle that completely overshadows the first.
Traders use the bearish engulfing pattern to identify potential opportunities to enter a short position, expecting a downward price movement. They can also use it as a signal to exit long positions.
While a bearish engulfing pattern signals a potential shift from a bullish trend to a bearish one, a bullish engulfing pattern indicates the opposite—a potential reversal from a bearish trend to a bullish one.
Yes, like all technical analysis tools, the bearish engulfing pattern can provide false signals. This is why it is crucial to use it in conjunction with other technical indicators and to always have a risk management strategy in place.
Traders should consider the market context in which the bearish engulfing pattern appears, the volume during the pattern's formation, and the overall market volatility. It's also essential to use additional technical indicators to confirm and establish clear stop loss and take profit levels.
True Tamplin is a published author, public speaker, CEO of UpDigital, and founder of Finance Strategists.
True is a Certified Educator in Personal Finance (CEPF®), author of The Handy Financial Ratios Guide, a member of the Society for Advancing Business Editing and Writing, contributes to his financial education site, Finance Strategists, and has spoken to various financial communities such as the CFA Institute, as well as university students like his Alma mater, Biola University, where he received a bachelor of science in business and data analytics.
To learn more about True, visit his personal website or view his author profiles on Amazon, Nasdaq and Forbes.


