
The hammer candlestick is a significant pattern in the realm of technical analysis , vital for predicting potential price reversals in markets. It manifests as a single candlestick pattern appearing at the bottom of a downtrend and signals a potential bullish reversal. Resembling a hammer in shape, hence its name, the hammer candlestick embodies a potent tool for understanding market sentiment and traders' behavior. As a herald of potential bullish reversals, the hammer candlestick possesses immense significance in market analysis. It offers traders a visual representation of the tug-of-war between buyers and sellers. The long lower shadow signifies a period during which sellers pushed prices lower, but buyers managed to pull the price back up, indicating a possible shift in momentum. Hammer candlesticks materialize during a downtrend when there's a significant sell-off early in the trading period, causing a drastic plunge in price. However, by the end of the trading period, buying pressure resurrects, pulling the price back up and hence, forming the characteristic hammer shape. The quintessential components of a hammer candlestick include a small real body at the top, a long lower shadow, and a short or absent upper shadow. This specific configuration results from a substantial intra-period rally following a steep initial decline—reflecting a potential transition from selling to buying pressure. In the formation of a hammer candlestick, volume plays a pivotal role. Higher trading volume on the hammer day increases its reliability as a bullish signal. An expanded volume indicates increased interest and the likelihood of a stronger reversal. There are two types of hammer candlesticks: bullish hammer and bearish hammer (also known as an inverted hammer). A bullish hammer is a single candlestick pattern primarily associated with bottom reversals. It's named for the hammer-like appearance of the candle and the fact that it's typically found during downtrends, where it can signal a potential bullish reversal. The hammer is composed of a small body, a little or no upper shadow (or wick), and a long lower shadow (the 'hammer' part), indicating that sellers pushed prices lower, but strong buying pressure pushed them back up to close near or above the opening price. The color of the body can be either green (or white) or red (or black) - the important part is the position and proportion of the body and the shadow. An inverted hammer occurs at the bottom of a downtrend and could indicate a bullish reversal. It looks exactly the same as the bullish hammer, except that it is found at the end of a downtrend. The long upper shadow suggests that the day's buying pressure pushed prices up significantly but that selling pressure eventually drove them back down to close near where they opened. It's considered a potential sign that sellers are exhausting their selling pressure, and buyers may be ready to take control. The following day's candle plays an integral role in confirming the hammer signal. Typically, a bullish confirmation is seen when the next day's candle closes above the high of the hammer candlestick. It suggests buyers have gained control, solidifying the hammer's reversal signal. The location of the hammer within a trend also contributes to its validity as a reversal signal. Hammers occurring after prolonged downtrends are seen as more reliable indicators of a potential bullish reversal than those appearing during sideways movements or within uptrends. Confirming a hammer signal benefits from correlation with other technical indicators like moving averages, RSI, or MACD. When these indicators align with the hammer's bullish reversal signal, it provides a more robust basis for a potential trade. When trading based on a hammer candlestick, setting stop-loss orders below the low of the hammer can limit potential downside risk. Profit targets can be set based on key resistance levels or using a risk-reward ratio in line with a trader's specific strategy. The hammer candlestick strategy becomes more effective when combined with known support or resistance levels. A hammer occurring at a significant support level represents a strong bullish reversal signal. Pairing the hammer with other candlestick patterns, like bullish engulfing or piercing patterns, can enhance the reliability of the bullish reversal signal. It provides an additional layer of validation to the hammer signal. Like any trading signal, hammer candlesticks can also provide false signals, leading to erroneous trades. This risk underscores the importance of using additional confirmation signals before entering a trade based on a hammer candlestick. High market volatility can lead to the formation of elongated shadows, creating hammer-like patterns that may not signify genuine reversals. Traders must be cautious during periods of high volatility and seek additional confirmations. Risk management strategies, including the use of stop-loss orders and position sizing, are crucial when trading based on hammer candlesticks. These strategies can limit potential losses if a trade goes against the expected direction. In the stock market, the hammer candlestick can indicate significant turning points in stock prices. It's particularly useful in volatile markets where rapid price swings can often lead to the formation of hammers. The forex market's 24-hour nature offers plenty of opportunities for hammer candlesticks to form, indicating potential reversals in currency price trends. Traders often look for hammers at the end of significant downtrends for potential entry points. In commodity markets, where supply and demand dynamics often cause sharp price movements, the hammer candlestick can provide valuable clues about potential trend reversals, helping traders time their entries and exit effectively. The Hammer Candlestick, a pattern in technical analysis, denotes a potential bullish market reversal. Its formation, characterized by a small real body at the candle's upper end and a long lower wick, transpires primarily during a downtrend when sellers initially dominate, but buyers eventually recover, pulling prices back up. This distinctive structure is more than mere market aesthetics—it symbolizes a pivotal shift in market sentiment, forecasting an uptrend. However, the interpretation of a Hammer Candlestick necessitates caution. While its occurrence is generally seen as a bullish reversal signal, traders must seek additional confirmation from subsequent price movements or other technical indicators. This critical approach ensures more robust and accurate trading decisions. Thus, understanding the definition, formation, and interpretation of a Hammer Candlestick equips traders with a valuable tool for navigating the financial markets.Definition of Hammer Candlestick
Formation of the Hammer Candlestick
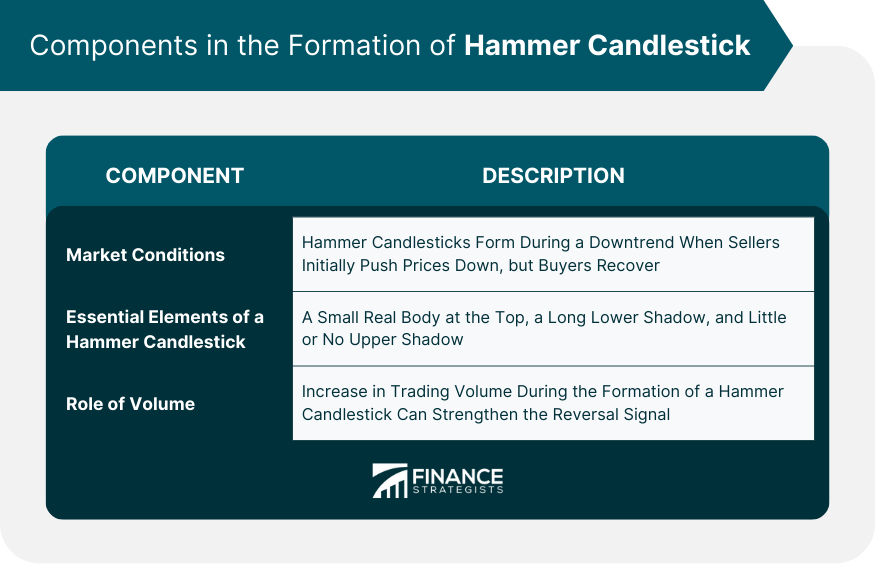
Market Conditions Leading to the Formation of Hammer Candlesticks
Essential Components of a Hammer Candlestick
Role of Volume in Hammer Candlestick Formation
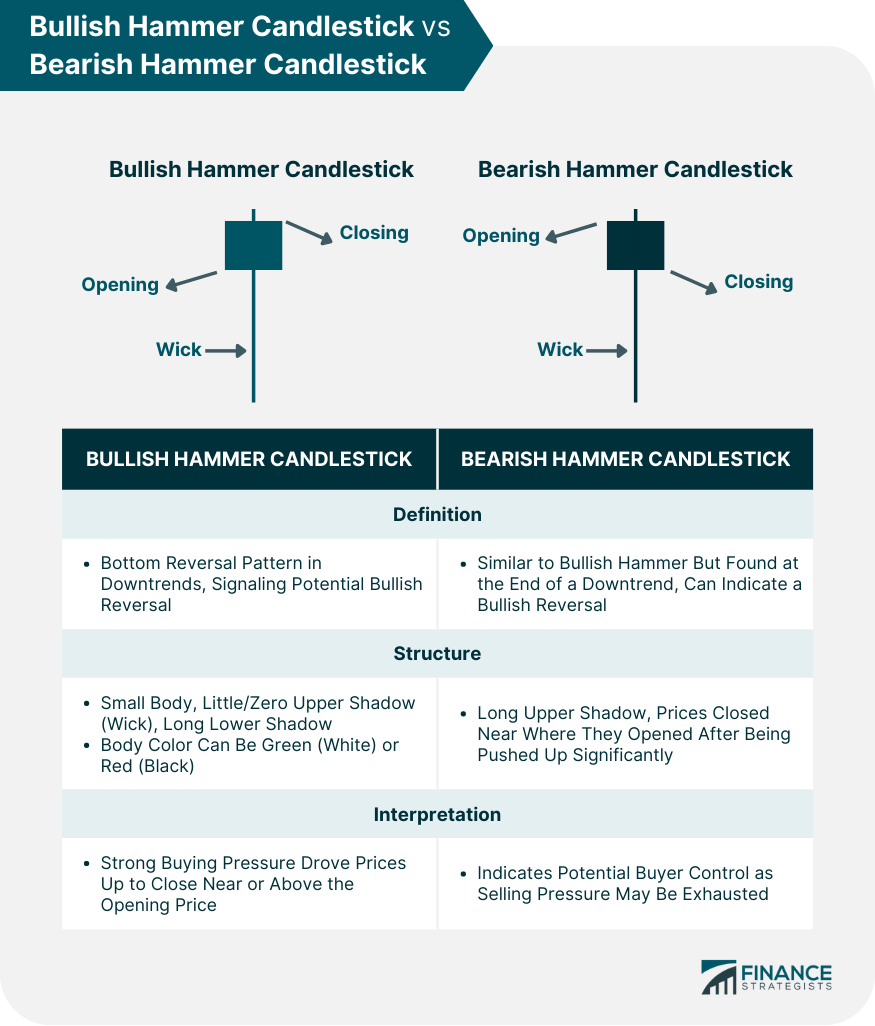
Structure and Interpretation of a Hammer Candlestick
Bullish Hammer Candlestick
Bearish Hammer Candlestick
Confirmation of the Hammer Candlestick Signal
Role of the Following Day's Candle
Importance of Location in a Trend
Correlation With Other Technical Indicators
Trading Strategies Based on the Hammer Candlestick
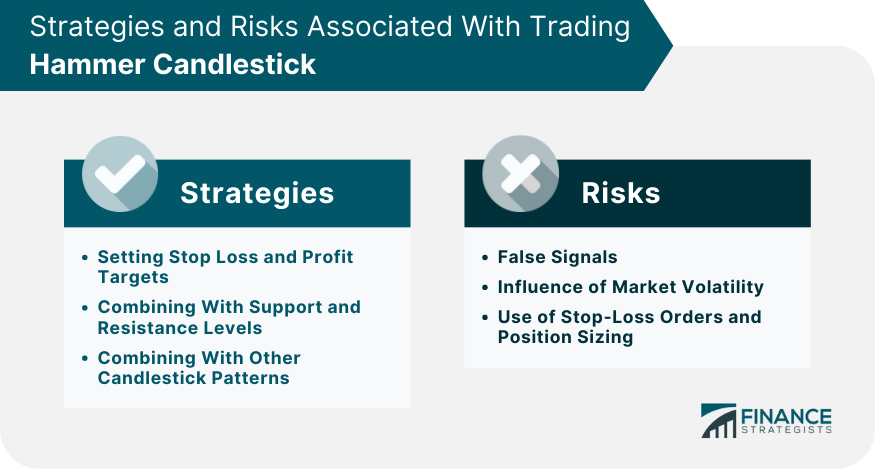
Setting Stop Loss and Profit Targets
Combining Support and Resistance Levels
Combining With Other Candlestick Patterns
Risks Associated With Trading Hammer Candlestick
False Signals
Influence of Market Volatility
Risk Management Strategies
Hammer Candlestick in Various Market Types
Stock Market
Forex Market
Commodity Market
Final Thoughts
Hammer Candlestick FAQs
A Hammer Candlestick is a bullish reversal pattern that appears during a downtrend in the market. It's characterized by a small body at the top and a long lower shadow or 'wick,' resembling a hammer.
A Hammer Candlestick forms when selling pressure dominates the market at the open, pushing prices lower, but then buying pressure takes over, driving prices up to close near the opening price. This pattern creates a small body with a long lower shadow.
The Hammer Candlestick typically indicates a potential bullish reversal, signaling that the market's selling pressure is weakening and buying pressure is strengthening. However, this signal should be confirmed with other indicators or subsequent price action.
Traders can use a Hammer Candlestick as an entry signal for a long position, expecting a bullish reversal. However, it's recommended to wait for confirmation from the next candle or other technical indicators to validate the signal.
The risks include potential false signals, where a Hammer Candlestick forms, but no bullish reversal follows. Market volatility can also create Hammer-like patterns without significant trend changes. Therefore, traders should use risk management strategies and seek confirmation signals.
True Tamplin is a published author, public speaker, CEO of UpDigital, and founder of Finance Strategists.
True is a Certified Educator in Personal Finance (CEPF®), author of The Handy Financial Ratios Guide, a member of the Society for Advancing Business Editing and Writing, contributes to his financial education site, Finance Strategists, and has spoken to various financial communities such as the CFA Institute, as well as university students like his Alma mater, Biola University, where he received a bachelor of science in business and data analytics.
To learn more about True, visit his personal website or view his author profiles on Amazon, Nasdaq and Forbes.


