
A trendline is a straight line that is drawn on a price chart to connect two or more price points, providing a visual representation of the direction and slope of a trend. In wealth management, trendlines are widely used in technical analysis to identify trends, determine support and resistance levels, and make informed investment decisions. Trendlines help investors and traders visualize the overall direction of a market or asset and provide insights into potential future price movements. Trendline analysis provides valuable insights into market trends and supports decision-making processes. This information helps investors and traders understand the underlying sentiment in the market and make more informed decisions about entry and exit points, as well as the timing of trades. The components of a trendline consist of data points, which are the price levels used to draw the line. Typically, two or more significant price points are selected to construct a trendline. In an uptrend, the trendline is drawn by connecting higher swing lows, while in a downtrend, it connects lower swing highs. The accuracy and reliability of the trendline depend on the selection of relevant and meaningful price points. The construction of a trendline involves drawing a line that connects the selected data points. The line should pass through or be as close as possible to the majority of the data points, capturing the essence of the trend. The slope of the trendline represents the steepness of the trend, while the angle at which the line is drawn indicates the strength and velocity of the trend. The length of the trendline depends on the timeframe being analyzed, and different timeframes may yield different trendlines. It is important to note that trendlines should not be forced to fit the data but should be drawn in a way that captures the essence of the trend and provides meaningful insights. An uptrend line is a trendline that slopes upwards, connecting a series of higher swing lows. It represents the overall upward movement of an asset's price, indicating bullishness in the market. Uptrend Lines act as dynamic support levels, providing a visual reference for the trend's strength and potential areas of buying interest. A downtrend line is a trendline that slopes downwards, connecting a series of lower swing highs. It represents the overall downward movement of an asset's price, indicating bearishness in the market. Downtrend Lines act as dynamic resistance levels, providing a visual reference for the trend's strength and potential areas of selling pressure. A horizontal trendline is a trendline that is drawn horizontally, connecting a series of price points at the same level. It represents a period of consolidation or indecision in the market. Horizontal trendlines act as support or resistance levels, indicating potential areas where price may bounce or reverse. Trendline analysis is a powerful tool for identifying market trends. By drawing trendlines, wealth managers can visually assess the direction and strength of a trend, whether it is an uptrend, downtrend, or a horizontal trend. This information helps in understanding the overall market sentiment and can guide investment decisions. Trendlines help determine key support and resistance levels in the market. In an uptrend, the trendline acts as dynamic support, where price tends to bounce off and continue the upward movement. In a downtrend, the trendline acts as dynamic resistance, where price tends to encounter selling pressure and reverse. These support and resistance levels help in setting profit targets and determining stop-loss levels to manage risk effectively. Trendline analysis provides valuable insights that can assist in making informed investment decisions. By considering the direction and slope of a trendline, wealth managers can gauge the strength and momentum of a trend. This information can be used to time entry and exit points, identify potential trend reversals, and align investment strategies with the prevailing market conditions. One of the challenges of trendline analysis is the subjectivity involved in drawing and interpreting trendlines. Different analysts may draw slightly different trendlines based on their selection of data points or the angle at which the line is drawn. This subjectivity can introduce some variability and may result in different interpretations of the trend. It is important for wealth managers to be aware of this limitation and exercise judgment when analyzing and utilizing trendlines. False breakouts occur when price briefly breaks above or below a trendline but fails to sustain the move. This can lead to misleading signals and result in potential losses or premature trade exits. False breakouts are a common occurrence in trendline analysis and can be challenging to navigate. Traders should consider using additional confirmation tools, such as technical indicators or candlestick patterns, to validate breakout signals and minimize the impact of false breakouts. Trendline analysis relies on historical price data, and its effectiveness is based on the assumption that historical patterns and trends will repeat in the future. However, market conditions can change, and past performance may not necessarily be indicative of future results. It is essential for wealth managers to conduct thorough backtesting and assess the historical performance of trendline analysis in different market environments to gain confidence in its potential effectiveness. Drawing trendlines using price action involves identifying significant swing highs and swing lows in the price chart. A swing high is a peak where price reverses from an uptrend to a downtrend, while a swing low is a trough where price reverses from a downtrend to an uptrend. By connecting these swing points, a trendline can be drawn to represent the overall trend. Moving averages can be used to draw trendlines by connecting the moving average values over a specific period. Moving averages smooth out price fluctuations and provide a visual representation of the trend's direction. Traders can utilize different types of moving averages, such as simple moving averages (SMA) or exponential moving averages (EMA), to draw trendlines based on their preferred timeframe and analysis. Trendline channels involve drawing parallel trendlines above and below the main trendline to create a channel. The upper trendline acts as a resistance level, while the lower trendline acts as a support level. Trendline channels provide a visual representation of the price range within which the trend is moving, allowing traders to identify potential areas of buying or selling interest. When a trendline is broken, it is important to confirm the breakout with additional technical indicators or chart patterns. Traders should look for increased volume, positive momentum indicators, or candlestick patterns that support the breakout signal. Confirmation helps reduce the likelihood of false breakouts and provides a stronger basis for decision making. Wealth managers should consider analyzing and drawing trendlines on multiple timeframes to gain a comprehensive understanding of the trend's direction. Trends may differ across different timeframes, and by assessing trends on various scales, wealth managers can better identify potential opportunities and make more informed investment decisions. As new price data becomes available, trendlines should be adjusted accordingly to accommodate the latest market information. Trendlines are not static and should be redrawn or modified as the trend evolves. This ensures that the trendlines accurately represent the current market conditions and provide relevant insights for decision making. A trendline is a graphical representation of the direction and strength of a market trend over a specific period. It consists of two components: the slope and the support or resistance level. There are different types of trendlines, including upward (bullish), downward (bearish), and horizontal (sideways). Each type provides unique information about the market dynamics. The analysis of trendlines helps identify market trends, support and resistance levels, and potential entry and exit points for investments. Trendline analysis can also aid in determining the overall market sentiment. However, there are challenges associated with trendline analysis. Market trends can be influenced by various factors, and trends may change or reverse unexpectedly. False breakouts or breakdowns can occur, leading to inaccurate predictions. Drawing trendlines requires careful consideration and adherence to certain techniques. The selection of data points, confirmation of trend direction, and ensuring multiple touches of the trendline by price action are crucial steps.What Is a Trendline?
Components of a Trendline
Data Points
Line Construction
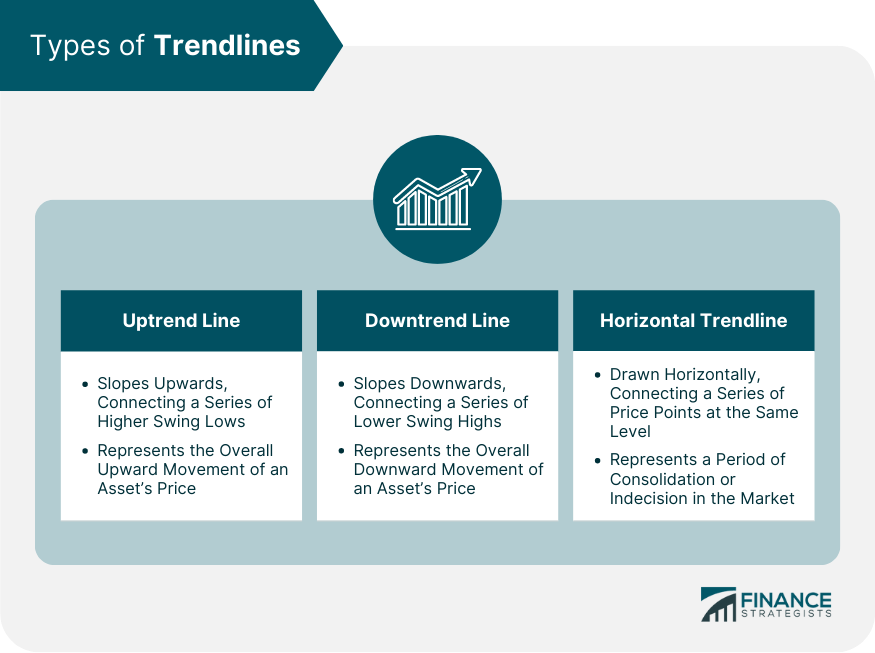
Types of Trendlines
Uptrend Line
Downtrend Line
Horizontal Trendline
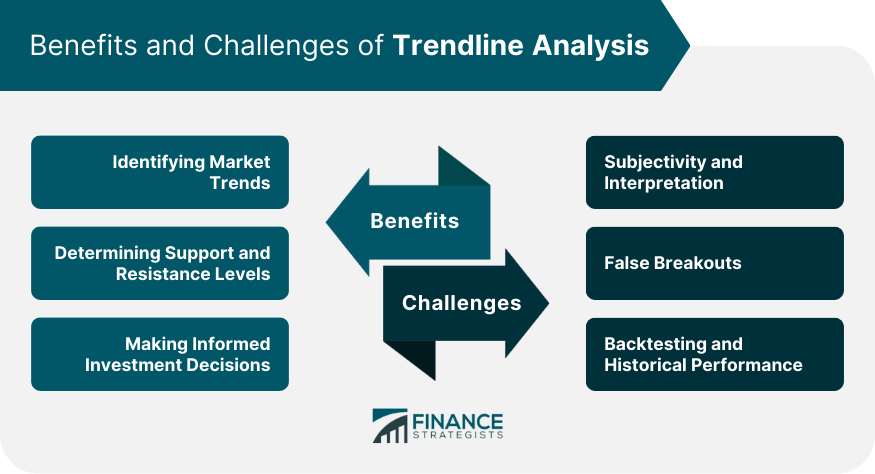
Benefits of Trendline Analysis in Wealth Management
Identifying Market Trends
Determining Support and Resistance Levels
Making Informed Investment Decisions
Challenges and Limitations of Trendline Analysis
Subjectivity and Interpretation
False Breakouts
Backtesting and Historical Performance
Techniques for Drawing Trendlines
Using Price Action
Utilizing Moving Averages
Applying Trendline Channels
Best Practices for Using Trendlines
Confirming Trendline Breakouts
Monitoring Multiple Timeframes
Adjusting Trendlines With New Data
Conclusion
Trendline FAQs
A trendline is a straight line drawn on a price chart to connect two or more price points. It provides a visual representation of the direction and slope of a trend, helping to identify the overall market sentiment.
Trendline analysis is important in wealth management as it helps identify market trends, determine support and resistance levels, and make informed investment decisions. It provides insights into the prevailing market conditions and assists in optimizing investment strategies.
The types of trendlines include uptrend lines, which slope upwards and indicate bullishness; downtrend lines, which slope downwards and indicate bearishness; and horizontal trendlines, which represent periods of consolidation or indecision in the market.
The benefits of trendline analysis in wealth management include identifying market trends, determining support and resistance levels, and making informed investment decisions. It helps wealth managers understand market sentiment and enhances the accuracy of investment strategies.
Challenges of trendline analysis include subjectivity and interpretation in drawing and interpreting trendlines, the occurrence of false breakouts, and the need for backtesting to assess historical performance. Wealth managers should be aware of these challenges and employ proper techniques to mitigate their impact.
True Tamplin is a published author, public speaker, CEO of UpDigital, and founder of Finance Strategists.
True is a Certified Educator in Personal Finance (CEPF®), author of The Handy Financial Ratios Guide, a member of the Society for Advancing Business Editing and Writing, contributes to his financial education site, Finance Strategists, and has spoken to various financial communities such as the CFA Institute, as well as university students like his Alma mater, Biola University, where he received a bachelor of science in business and data analytics.
To learn more about True, visit his personal website or view his author profiles on Amazon, Nasdaq and Forbes.


