
Financial market patterns are consistent and predictable behaviors or trends that prices follow on a chart. They occur due to various market forces, including economic factors, investor sentiment, and supply and demand dynamics. These patterns provide traders with potential insights into future market movements. Candlestick patterns, originating from Japanese rice traders in the 18th century, are a graphical representation of price movements in a specified timeframe. These patterns are crucial for traders, as they can convey a wealth of information at a glance. They assist traders in understanding market sentiment and predicting potential price reversals, thus informing investment decisions and risk management strategies. Dark Cloud Cover is a bearish reversal candlestick pattern appearing in an uptrend. It consists of a long bullish candle followed by a bearish one that opens above the high of the previous day's candle but closes below the midpoint of the first candle's body. As a member of the candlestick pattern family, the Dark Cloud Cover is a manifestation of a shift in market sentiment. In the context of a prevailing uptrend, it signifies the potential exhaustion of the bullish trend and the possible onset of a bearish reversal. The formation of a Dark Cloud Cover pattern begins with a prevailing bullish market. The upward trend signifies positive market sentiment with more buyers than sellers, driving the prices up. On the first day of the pattern's formation, the bullish sentiment is confirmed with a strong bullish candle. The candle's body, the difference between the open and close prices, is long, signifying a significant price increase during the day. The second day is where the Dark Cloud Cover pattern begins to emerge. Despite opening at a new high, the day concludes with a bearish candle, symbolizing a shift in market sentiment. The second day's bearish candle opens with a gap up from the previous day's close - a scenario often seen following a strong bullish trend. This gap up is a crucial element of the Dark Cloud Cover pattern as it illustrates the climax of the bullish momentum. The defining characteristic of the Dark Cloud Cover pattern is the second day's bearish candle closing below the midpoint of the first day's bullish candle. This closure signifies a substantial sell-off, indicating the bears' attempt to take control of the market. In technical analysis, the Dark Cloud Cover serves as a potential indicator of an impending bearish reversal. Recognizing this pattern can help traders anticipate a possible downturn and adjust their strategies accordingly. Similar to the Dark Cloud Cover, other candlestick patterns like the Bearish Engulfing or the Evening Star also indicate potential bearish reversals. However, each pattern has unique formation requirements and varying degrees of reliability. Confirmation in the context of the Dark Cloud Cover pattern means validating the bearish reversal signal. This validation often comes from a subsequent price action, such as another bearish candle following the pattern, or a gap down. The confirmation could come in several forms - another bearish candle closing below the Dark Cloud Cover, a gap down the following day, or even a higher volume on the second day of the pattern. Volume plays a significant role in confirmation. A higher trading volume on the second day of the Dark Cloud Cover pattern can indicate stronger selling pressure, supporting the bearish reversal signal. Trading strategies utilizing the Dark Cloud Cover require careful planning. These include setting up entry points, stop-loss orders, and exit points. Traders typically enter a short position after the confirmation of the pattern, placing stop-loss orders above the pattern's high. Risk management is crucial in any trading strategy. Traders should determine their risk tolerance and ensure they do not expose too much of their capital to a single trade. In the case of the Dark Cloud Cover, it would be prudent to place a stop-loss order to limit potential losses if the price reverses. While the Dark Cloud Cover is a valuable tool, it can produce false signals. Market volatility or other macroeconomic factors can lead to the pattern's formation, yet the anticipated bearish reversal might not materialize. It's essential to consider contextual market factors such as overall trends, economic data releases, and company-specific news. These factors can significantly influence the efficacy of the Dark Cloud Cover pattern. While both the Dark Cloud Cover and the Bearish Engulfing pattern signal potential bearish reversals, they have a critical difference. The Bearish Engulfing pattern's second candle fully engulfs the first candle, unlike the Dark Cloud Cover, where the bearish candle closes below the midpoint of the previous bullish candle. The Evening Star is a three-candle bearish reversal pattern that appears after an uptrend, while the Dark Cloud Cover is a two-candle pattern. The Evening Star comprises a long bullish candle, a small-bodied star, and a long bearish candle, making it more complex than the Dark Cloud Cover. The Dark Cloud Cover is a bearish reversal candlestick pattern characterized by a strong bullish candle followed by a bearish candle that opens higher but closes below the midpoint of the first candle's body. The Dark Cloud Cover pattern serves as a warning sign to traders, indicating a possible exhaustion of the bullish trend and the start of a bearish reversal. When recognized and confirmed, it can assist traders in adjusting their strategies and making informed investment decisions. Confirmation of the Dark Cloud Cover pattern can come in various forms, such as another bearish candle closing below the pattern, a gap down, or higher trading volume on the second day. Traders can develop trading strategies around this pattern by setting entry points, stop-loss orders, and exit points. Risk management is crucial, and traders should consider their risk tolerance and implement appropriate stop-loss orders. It is important to note the limitations of the Dark Cloud Cover. False signals can occur due to market volatility or other macroeconomic factors, emphasizing the need to consider contextual market factors and trends. Additionally, comparisons with other bearish reversal patterns like the Bearish Engulfing and Evening Star highlight their unique characteristics and formation requirements. While understanding candlestick patterns like the Dark Cloud Cover is beneficial, seeking professional advice can help align your trading strategies with your investment goals and risk tolerance.Financial Market Patterns: Overview
What Is a Dark Cloud Cover?
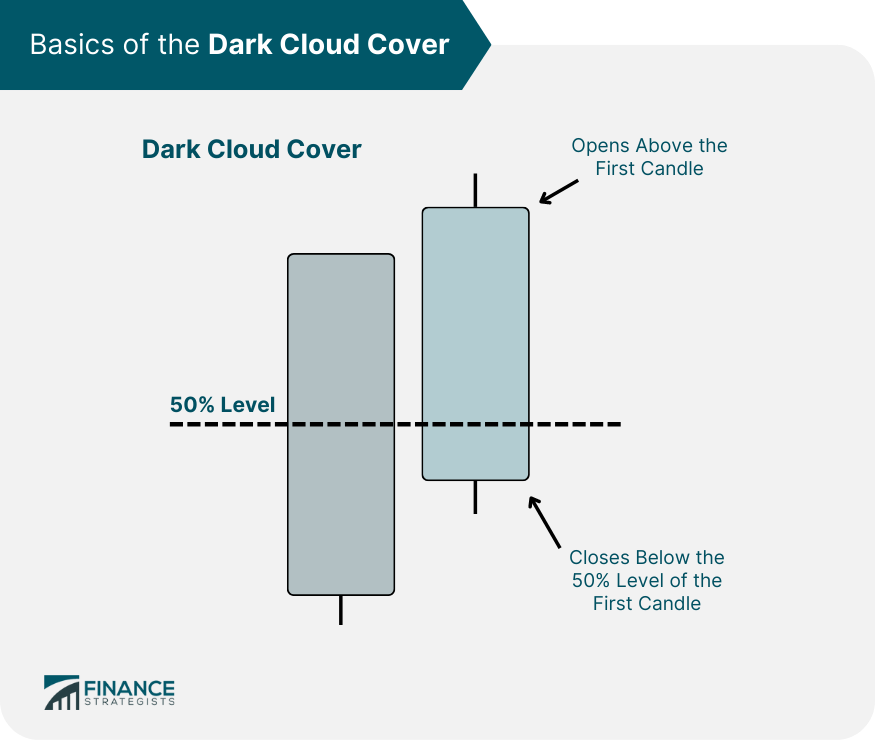
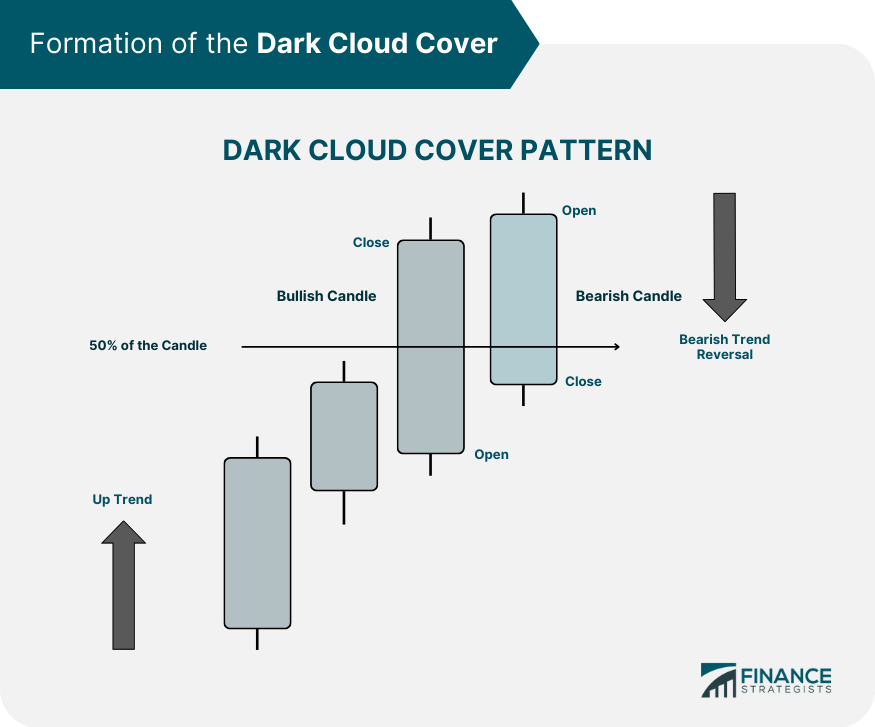
The Formation of the Dark Cloud Cover
Explanation of Bullish Market Preceding the Dark Cloud Cover
Analysis of the First Day's Strong Bullish Candle
Examination of the Second Day's Bearish Candle
Importance of the Gap up at Open on the Second Day
Closing of the Second Day Candle Within the Body of the First Day’s Candle
The Dark Cloud Cover in Technical Analysis
Significance of the Dark Cloud Cover in Technical Analysis
Comparisons With Other Candlestick Patterns
Understanding the Confirmation of the Dark Cloud Cover
Definition of Confirmation in the Context of the Dark Cloud Cover
Possible Confirmation Scenarios
Role of Volume in Confirmation
Trading Strategies Using the Dark Cloud Cover
Basics of Developing a Trading Strategy Based on the Pattern
Risk Management Considerations
Limitations and Cautions With the Dark Cloud Cover
Possibility of False Signals
Importance of Contextual Market Factors
Dark Cloud Cover vs Other Bearish Reversal Patterns
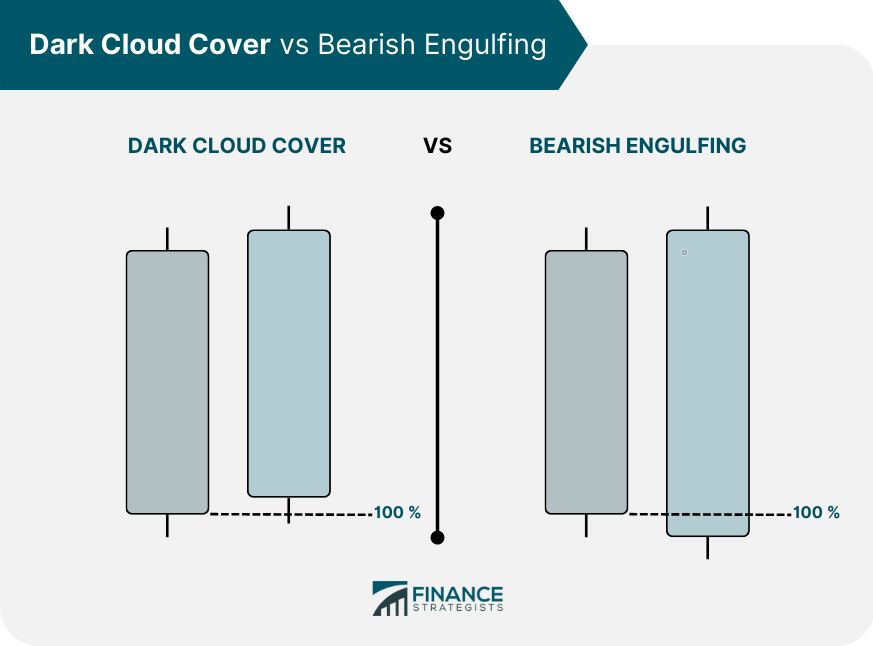
Comparison With the Bearish Engulfing Pattern
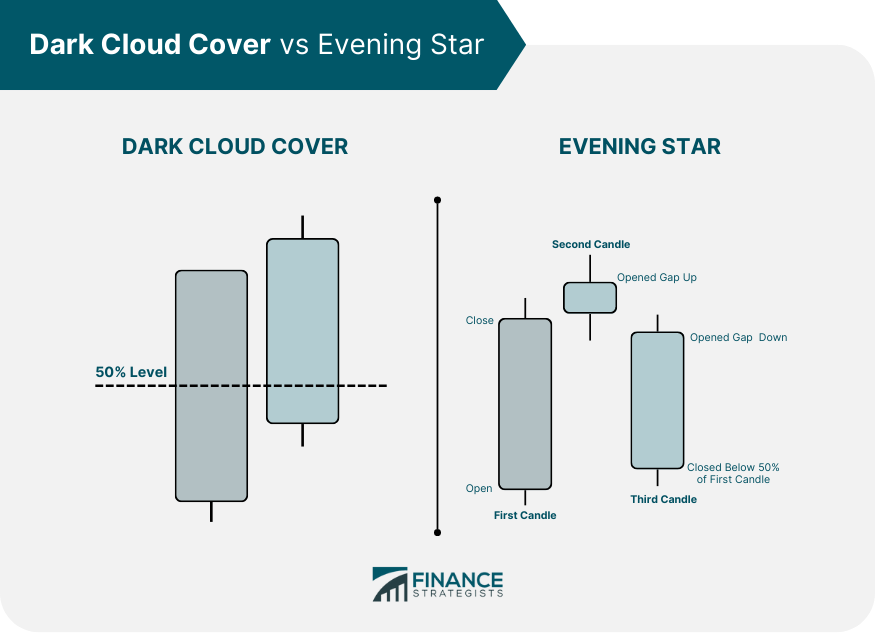
Comparison With the Evening Star Pattern
Final Thoughts
Dark Cloud Cover FAQs
The Dark Cloud Cover is a bearish reversal candlestick pattern indicating a potential downturn in the market.
The pattern forms in an uptrend and consists of a long bullish candle followed by a bearish candle. The bearish candle opens above the first candle's high but closes below the midpoint of its body.
Traders use the Dark Cloud Cover to anticipate potential bearish reversals, allowing them to adjust their trading strategies accordingly.
While it signals a potential bearish reversal like other similar patterns, the Dark Cloud Cover has unique formation requirements and is less complex than some other patterns, such as the Evening Star.
Yes, the Dark Cloud Cover can produce false signals. Therefore, it should be used with other technical indicators and within the broader market context.
True Tamplin is a published author, public speaker, CEO of UpDigital, and founder of Finance Strategists.
True is a Certified Educator in Personal Finance (CEPF®), author of The Handy Financial Ratios Guide, a member of the Society for Advancing Business Editing and Writing, contributes to his financial education site, Finance Strategists, and has spoken to various financial communities such as the CFA Institute, as well as university students like his Alma mater, Biola University, where he received a bachelor of science in business and data analytics.
To learn more about True, visit his personal website or view his author profiles on Amazon, Nasdaq and Forbes.


