
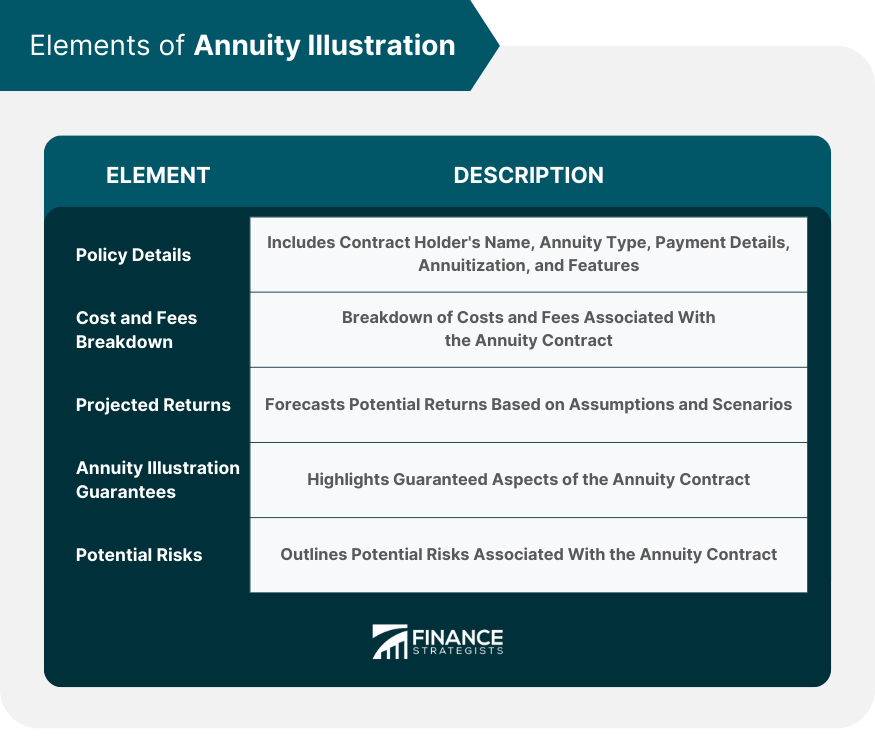
An annuity illustration is a comprehensive projection of an annuity contract's performance over time, given various economic conditions and contract-specific variables. This document is typically provided by the insurer to prospective annuity purchasers. It includes detailed information on policy details, costs, potential returns, guarantees, and associated risks. In financial planning, an annuity illustration plays a significant role as it helps individuals visualize their potential future income from the annuity contract. It aids in making informed decisions, comparing various annuity offerings, and aligning one's long-term financial goals with the annuity's benefits. Therefore, understanding and interpreting an annuity illustration is critical for both financial advisors and individuals involved in retirement planning and wealth management. The annuity illustration begins with the policy's details. This typically includes the contract holder's name, the annuity type (fixed, variable, or indexed), premium payment details, annuitization phase details, and any special features or riders attached to the annuity contract. It will also include the terms of the annuity, such as the period of the contract and the start date of income payments. Annuity illustrations also provide a breakdown of the costs and fees associated with the contract. This often includes insurance charges, administrative fees, surrender charges, fund management fees (for variable annuities), and any costs related to special riders. These costs can significantly impact the contract's net return, making it essential for prospective buyers to understand these charges thoroughly. This section of the annuity illustration forecasts the potential returns from the annuity contract over its lifetime. The projected returns can be based on a number of different assumptions and scenarios, such as the insurer's current interest rate for fixed annuities or historical investment performance for variable annuities. It is crucial to note that these are only projections, and the actual returns may differ. Annuity contracts often come with certain guarantees, which are also depicted in the annuity illustration. For instance, fixed annuities usually guarantee a minimum rate of return and a certain payout during the annuitization phase. Variable annuities, on the other hand, may offer a death benefit guarantee or a minimum income benefit guarantee. A comprehensive annuity illustration also outlines the potential risks associated with the annuity contract. This can include the risk of lower-than-expected returns in case of poor market performance (for variable annuities), the insurer's credit risk, and liquidity risk due to early withdrawal penalties. This information assists potential buyers in assessing whether the annuity contract aligns with their risk tolerance and financial objectives. The policy details are crucial, as they outline the fundamental elements of the annuity contract. Always ensure that these details meet your expectations. They should align with your needs, investment goals, and risk tolerance. The policy details include things like the type of annuity (fixed, variable, indexed), the term of the contract, and any unique features or riders that come with the policy. The cost breakdown in an annuity illustration provides a clear view of the various fees and charges that the annuity contract carries. Carefully examine each item to ensure that there are no hidden or unnecessarily high charges. Costs to look out for include management fees, insurance charges, administrative costs, and any surrender charges in case of early withdrawal. One of the most crucial parts of an annuity illustration is the section on projected returns. While these figures are estimates, they give you an idea of what your investment might earn over time. Remember that actual returns can and often do differ from these projections, especially in variable or indexed annuities that depend on market performance. Guarantees in an annuity contract refer to the minimum benefits that the insurance company promises to provide, regardless of how the underlying investments perform. These guarantees could include a certain rate of return, death benefits, or a fixed income stream during the annuitization phase. Determine whether these guarantees provide adequate protection for your financial goals. Understanding the risks associated with your annuity contract is equally important. This includes potential loss of principal in a variable annuity, the risk of outliving your assets, and the risk of early withdrawal penalties. Knowing these risks helps you prepare for worst-case scenarios. Interpreting the scenarios presented in an annuity illustration can significantly assist in decision-making. The following sections provide a more detailed look at these scenarios and their implications. Annuity illustrations often include scenarios that show the potential returns under various market conditions. These can help you get an idea of how the annuity might perform in both favorable and unfavorable market environments. Another scenario to examine is the effect of various charges on the net value of the annuity contract. This will show you how much the charges could potentially reduce your returns over time. Some annuity illustrations show the implications of making early withdrawals from your contract. These withdrawals can result in surrender charges and can also affect the growth of your investment. Finally, consider the scenario that shows the income stream during the annuitization phase. This is the phase when you start receiving income from your annuity. Understanding this scenario will help you plan for your retirement income. One of the main uses of annuity illustrations is to compare different annuity products. By evaluating the policy details, costs, projected returns, guarantees, and risks side by side, individuals can select the annuity that best fits their needs and financial goals. The comparison should not just focus on the potential returns, but also take into consideration the associated costs and risks. Annuity illustrations can also be used as a tool to assess one's long-term financial goals, particularly in terms of retirement planning. By projecting the potential income stream from the annuity, individuals can estimate their future financial stability and compare it with their desired retirement lifestyle. This can help in deciding the adequacy of the annuity and whether additional savings or investments are needed. Annuity illustrations offer a detailed picture of the potential risks and returns associated with the annuity contract. By examining these aspects, individuals can gauge their comfort level with the risk-return trade-off and adjust their investment decisions accordingly. This is particularly important for variable annuities, where the returns are tied to market performance. Ultimately, the annuity illustration provides the necessary information for individuals to make informed decisions. By understanding and interpreting the illustration properly, individuals can select the annuity product that aligns with their risk tolerance, financial objectives, and long-term goals. There are several legal requirements that insurers must adhere to when providing annuity illustrations. These requirements vary by jurisdiction but generally mandate that the illustrations be fair, accurate, and not misleading. They also dictate what information must be included in the illustration and how it should be presented. In addition to the legal requirements, there are also industry standards that insurers follow when preparing annuity illustrations. For example, in the United States, the National Association of Insurance Commissioners (NAIC) has established guidelines for annuity illustrations, including standards for the content, format, and presentation of the illustrations. Insurers who provide misleading or inaccurate annuity illustrations can face penalties, including fines, license suspension, or even legal action. This underscores the importance of accuracy and transparency in annuity illustrations, both for the protection of consumers and the integrity of the insurance industry. While annuity illustrations are designed to provide clarity, they can often be complex and difficult for the average consumer to understand. They may include financial jargon, complex calculations, and assumptions that are not clearly explained. This can lead to confusion and misunderstanding, potentially resulting in poor financial decisions. Consumers may misinterpret the information, particularly when it comes to projected returns and risks. Similarly, insurers may present the information in a way that highlights the positive aspects while downplaying the potential downsides. This can lead to unrealistic expectations and uninformed decisions. To address these criticisms and limitations, there are several suggestions for improving annuity illustrations. These include simplifying the language and layout to enhance understanding, providing clear explanations of all assumptions and calculations, and including a balanced view of both the potential benefits and risks. Additionally, financial advisors can play a critical role in explaining the illustration to their clients and ensuring they have a complete understanding before making a decision. An annuity illustration, a pivotal document in the world of financial planning, is a detailed projection of an annuity contract's potential performance, showcasing critical elements such as policy details, cost breakdown, projected returns, guarantees, and possible risks. Reading and understanding this document is essential, as it helps potential investors make well-informed decisions and compare various annuity products effectively. The annuity illustration also serves as an essential tool to assess and align with one's long-term financial goals while identifying potential risks and returns. However, it is worth remembering that while the illustration is a valuable tool, it does not replace professional financial advice. Hence, it is advisable to consult with an insurance broker or financial advisor to ensure the annuity aligns seamlessly with your unique financial goals and risk tolerance.What Is Annuity Illustration?
Elements of Annuity Illustration
Policy Details in Annuity Illustration
Cost and Fees Breakdown in Annuity Illustration
Projected Returns in Annuity Illustration
Annuity Illustration Guarantees
Potential Risks Displayed in Annuity Illustration
Detailed Guide on Reading the Data in Annuity Illustration
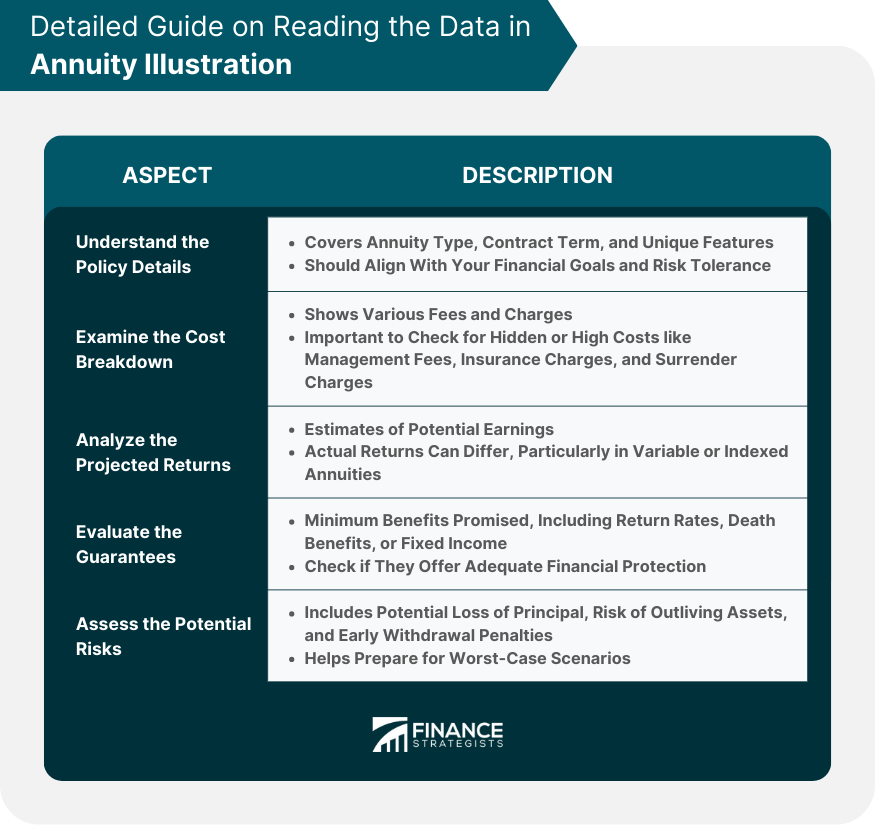
Understanding the Policy Details
Examining the Cost Breakdown
Analyzing the Projected Returns
Evaluating the Guarantees
Assessing the Potential Risks
Interpreting Annuity Illustration Scenarios
Expected Returns Under Different Market Conditions
Impact of Charges on Contract's Net Value
Understanding the Impact of Early Withdrawals
Income Stream During the Annuitization Phase
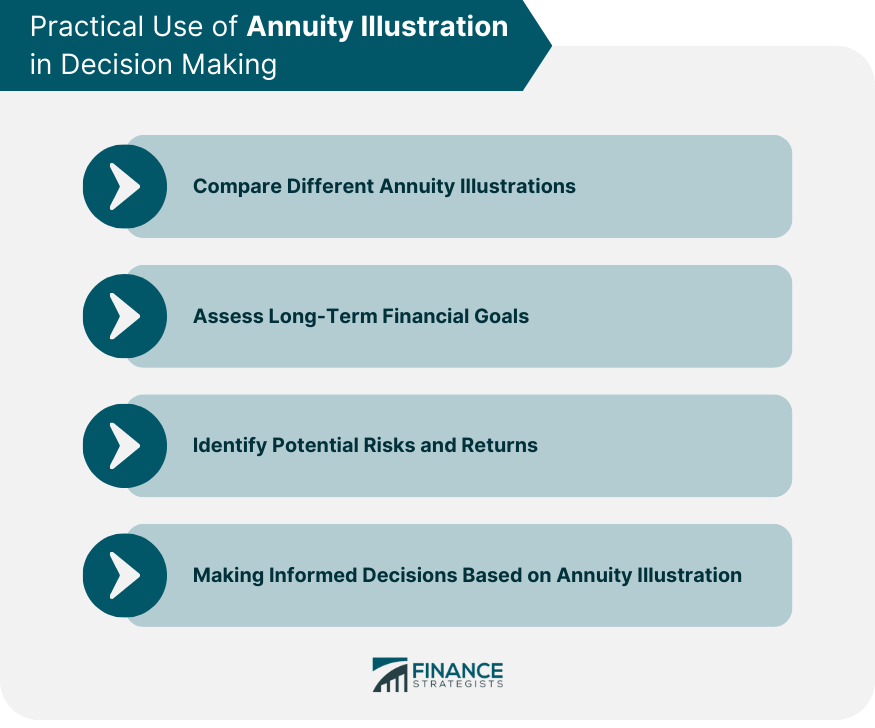
Practical Use of Annuity Illustration in Decision Making
Comparing Different Annuity Illustrations
Assess Long-Term Financial Goals
Identifying Potential Risks and Returns With Annuity Illustration
Making Informed Decisions Based on Annuity Illustration
Regulations and Guidelines for Annuity Illustration
Legal Requirements for Annuity Illustration
Regulatory Standards for Annuity Illustration
Penalties for Misleading or Inaccurate Annuity Illustration
Criticisms and Limitations of Annuity Illustration
Challenges in Understanding Annuity Illustration
Risks of Misinterpretation or Misrepresentation of Annuity Illustration
Suggestions for Improving Annuity Illustration
Final Thoughts
Annuity Illustration FAQs
An annuity illustration is a document provided by an insurer that gives a detailed projection of an annuity contract's performance over time, including policy details, costs, projected returns, guarantees, and risks.
An annuity illustration is important as it helps individuals understand the potential future income from an annuity contract, enabling them to make informed decisions about their long-term financial goals.
An annuity illustration typically includes policy details, a breakdown of costs and fees, projected returns, any guarantees provided by the contract, and potential risks associated with the annuity.
An annuity illustration allows individuals to compare different annuity products side by side. By evaluating the policy details, costs, projected returns, guarantees, and risks, individuals can choose the annuity that best fits their needs.
While an annuity illustration provides valuable information, it can be complex and difficult to understand. There's also a risk of misinterpretation or misrepresentation, potentially leading to unrealistic expectations or uninformed decisions.
True Tamplin is a published author, public speaker, CEO of UpDigital, and founder of Finance Strategists.
True is a Certified Educator in Personal Finance (CEPF®), author of The Handy Financial Ratios Guide, a member of the Society for Advancing Business Editing and Writing, contributes to his financial education site, Finance Strategists, and has spoken to various financial communities such as the CFA Institute, as well as university students like his Alma mater, Biola University, where he received a bachelor of science in business and data analytics.
To learn more about True, visit his personal website or view his author profiles on Amazon, Nasdaq and Forbes.


