
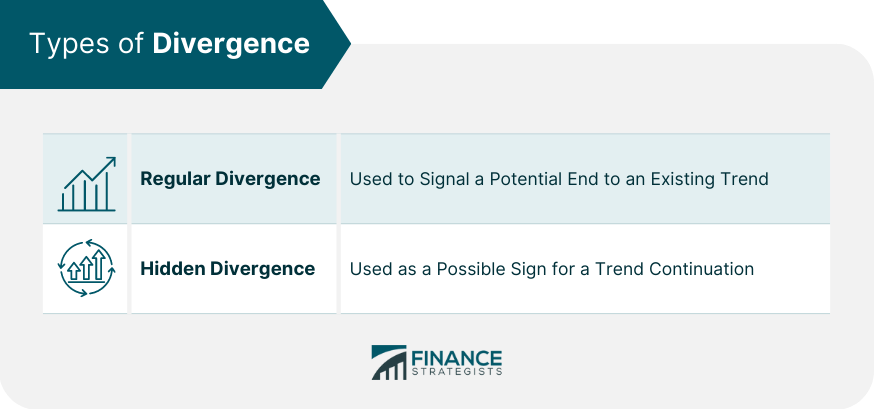
Divergence is a phenomenon where the price of an asset, such as a stock or a currency pair, and a related indicator or another asset, move in opposite directions. In other words, when the price of an asset is making a higher high but the indicator is making a lower high (or vice versa), this discrepancy is identified as divergence. Understanding divergence is of paramount importance in financial analysis because it can signal a potential reversal in the current market trend. Traders often use divergence as a key tool to predict whether the current market sentiment is about to change, thus providing valuable insights into potential investment or trade timing. However, like any analytical tool, it should not be used in isolation but rather in conjunction with other indicators to make a comprehensive investment decision. Regular divergence, also known as classic divergence, is typically used to signal a potential end to an existing trend. It can be classified further into bullish divergence and bearish divergence. Bullish divergence occurs when the price is making lower lows, but the indicator is making higher lows. Conversely, bearish divergence happens when the price makes a higher high, but the indicator makes a lower high. Hidden divergence, on the other hand, is used as a possible sign for a trend continuation. In a bullish hidden divergence, the price makes higher lows, but the indicator makes lower lows. In contrast, a bearish hidden divergence is spotted when the price makes lower highs while the indicator makes higher highs. One of the principal roles of divergence in technical analysis is to identify potential reversals in market trends. When the price of an asset diverges from an indicator, it often signals a shift in market sentiment. This discrepancy can help traders anticipate future price movements and make informed decisions about when to enter or exit trades. There are several key tools that traders commonly use to spot divergence. These include moving averages, the Moving Average Convergence Divergence (MACD), and the Relative Strength Index (RSI). Moving averages, as the name suggests, calculate the average price of an asset over a specified number of periods, which helps smooth out price fluctuations and identify the overall price trend. MACD and RSI are momentum indicators that measure the speed and change of price movements to detect potential overbought or oversold conditions. Like all trading signals, divergence is not foolproof and can result in false signals. False divergence happens when the price and indicator appear to be diverging, but the trend does not reverse as expected. This scenario underscores the importance of using divergence in conjunction with other technical indicators to validate potential trading signals. Divergence has a close relationship with momentum indicators. As momentum indicators measure the speed and change of price movements, they often diverge before the price does, providing early warning signals of potential trend reversals. When the price of an asset continues to rise, but the momentum starts to wane, it can lead to a bearish divergence. Conversely, when the price continues to fall but the momentum begins to pick up, it can result in a bullish divergence. Divergence can also occur between volume and price. When trading volume is increasing but the price is not following suit, it can signal a potential trend reversal. This divergence suggests that the current price trend may be losing strength and could reverse soon. Traders can effectively integrate divergence into their trading plans as a method for identifying potential trend reversals. By doing so, traders can time their trade entries and exits more accurately and potentially increase their chances of a profitable trade. However, traders should always remember to consider other technical and fundamental factors in their decision-making process. In Forex trading, divergence can be a powerful tool for predicting price movements. For instance, if a currency pair's price is making higher highs, but the momentum indicator is making lower highs, it could signal a potential bearish reversal. Traders can use this information to plan their trades accordingly. One of the primary risks of divergence-based trading is the possibility of false signals. Divergence occurs when the price of an asset and an indicator move in opposite directions, suggesting a potential trend reversal. However, divergence signals are not always accurate, and the market may not reverse as expected. Traders should validate divergence signals with other technical indicators or fundamental analysis to reduce the risk of false readings. Divergence is based on the comparison between price and indicators, which are often lagging in nature. By the time divergence is identified, the market may have already started to reverse or the trend may have exhausted. This lag can lead to missed opportunities or entering trades too late, reducing the effectiveness of divergence as a predictive tool. Divergence-based trading may be less effective in highly volatile market conditions. Sharp price swings and erratic movements can result in frequent divergence signals that may not accurately reflect the overall market trend. Interpreting divergence requires subjective analysis and judgment. Traders may have different opinions on the significance and validity of divergence signals. This subjectivity can introduce biases and inconsistencies in trading decisions, leading to potential errors. Divergence is often used in conjunction with other technical indicators to confirm trading signals. However, different indicators may generate conflicting signals or overlapping divergence patterns, making it challenging to determine the most reliable course of action. Divergence-based trading focuses primarily on price and indicator relationships, neglecting the influence of external factors such as news events, economic data, or geopolitical developments. These factors can override divergence signals and cause unexpected market movements, making it important to consider a comprehensive range of information in the decision-making process. Divergence can often be influenced by psychological factors. For instance, when investors are overly optimistic, they might ignore bearish divergence signals, causing prices to become overinflated. On the other hand, if investors are excessively pessimistic, they may overlook bullish divergence signals, leading to undervalued prices. Divergence can significantly impact investor sentiment. When investors notice divergence, it can cause them to reassess their market view and potentially change their investment strategy. This shift can in turn influence market trends and prices. In portfolio management, understanding divergence can be useful for asset allocation decisions. When certain asset classes or sectors show divergence, it may be an opportune time to rebalance the portfolio. For instance, if stocks are showing bearish divergence while bonds are showing bullish divergence, a portfolio manager might decide to decrease the allocation to stocks and increase the allocation to bonds. Divergence can also be a useful tool for risk management. By providing early warning signals of potential trend reversals, divergence can help portfolio managers adjust their strategies and mitigate potential risks. Divergence in financial markets is a scenario where the price of an asset and a related indicator or another asset move in opposite directions. It can signal potential reversals in market trends, providing valuable insights for traders and investors. By analyzing the price of an asset in relation to indicators or other assets, traders can gain insights into market sentiment and make informed decisions about investment or trade timing. Traders should consider other technical and fundamental factors and integrate divergence into a comprehensive trading plan to increase the likelihood of successful trades. Furthermore, divergence extends its significance beyond trading strategies. By monitoring divergence across different asset classes or sectors, portfolio managers can identify opportunities for rebalancing portfolios and adjusting allocations based on diverging trends. Additionally, divergence serves as a risk management tool by providing early warning signals of potential trend reversals. This allows portfolio managers to adapt their strategies and mitigate risks associated with changing market conditions. However, it is essential to recognize that divergence is just one component of a broader investment framework and should be considered alongside other factors to make well-rounded portfolio decisions. By consulting with a financial advisor or professional trader, individuals can gain expert insights and advice tailored to their specific financial goals and risk tolerance.What Is Divergence?
Types of Divergence
Regular Divergence
Hidden Divergence
Divergence in Technical Analysis
Role of Divergence in Identifying Market Trends
Tools for Spotting Divergence
Cases of False Divergence
Divergence and Financial Indicators
Momentum Indicators
Volume and Price
Using Divergence in Trading Strategies
Integration Into Trading Plans
Divergence in Forex Trading
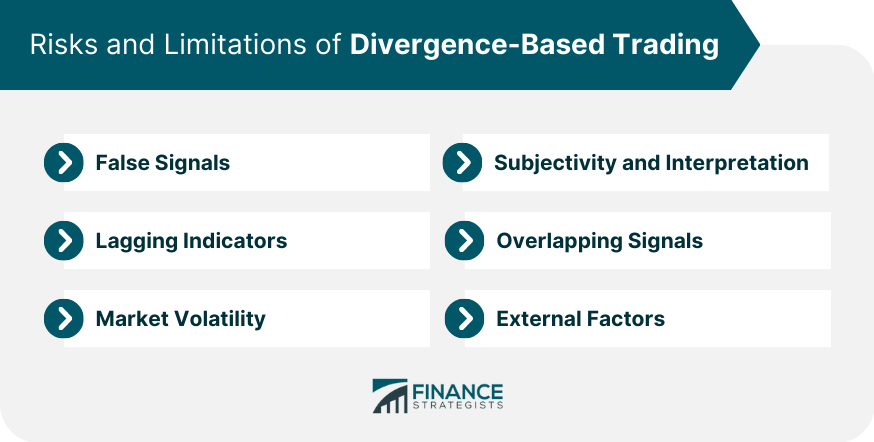
Risks and Limitations of Divergence-Based Trading
False Signals
Lagging Indicators
Market Volatility
Subjectivity and Interpretation
Overlapping Signals
External Factors
Divergence and Behavioral Finance
Psychological Factors
Impact on Investor Sentiment
Divergence in Portfolio Management
Asset Allocation
Risk Management
Final Thoughts
While understanding divergence can be helpful for making informed investment decisions, it's also important to seek professional advice. Financial markets can be complex and unpredictable, and individual investors might not always have the time or expertise to fully understand every aspect.
Divergence FAQs
The purpose of using divergence in financial analysis is to identify potential reversals in market trends. It helps traders and investors anticipate changes in market sentiment, providing valuable insights into when to enter or exit trades and make informed investment decisions.
Divergence can be integrated into trading strategies as a method for identifying potential trend reversals. By analyzing the price of an asset in relation to indicators or other assets, traders can time their trade entries and exits more accurately, potentially increasing their chances of profitability.
One significant risk is that divergence can sometimes result in false signals, leading to incorrect trading decisions. It is important to validate divergence signals with other technical indicators to reduce the risk of false readings. Additionally, divergence is not a guarantee of a particular outcome, so it should be used as part of a broader, well-rounded trading strategy.
Yes, divergence can be useful in portfolio management. By monitoring divergence across different asset classes or sectors, portfolio managers can identify opportunities for rebalancing portfolios. They can adjust allocations based on diverging trends, potentially optimizing the risk-return profile of the portfolio.
Divergence can significantly impact investor sentiment. When investors observe divergence, it can lead to a reassessment of their market view and potentially influence their investment strategy. This shift in sentiment can, in turn, have an impact on market trends and prices as a larger number of investors adjust their positions based on the observed divergence.
True Tamplin is a published author, public speaker, CEO of UpDigital, and founder of Finance Strategists.
True is a Certified Educator in Personal Finance (CEPF®), author of The Handy Financial Ratios Guide, a member of the Society for Advancing Business Editing and Writing, contributes to his financial education site, Finance Strategists, and has spoken to various financial communities such as the CFA Institute, as well as university students like his Alma mater, Biola University, where he received a bachelor of science in business and data analytics.
To learn more about True, visit his personal website or view his author profiles on Amazon, Nasdaq and Forbes.


