
The Kijun Line, also known as the Base Line, is a critical component of the Ichimoku Kinko Hyo trading system, a comprehensive technical indicator developed by Goichi Hosoda. Calculated as the average of the highest high and the lowest low over a certain period (typically 26 periods), the Kijun Line serves as a key indicator of future price movement. Its primary purpose is to provide signals for traders by functioning as a trigger line for buy and sell signals. Understanding the Kijun Line offers enhanced insight into market momentum, helping to formulate robust trading strategies. It also acts as a dynamic support or resistance level, enhancing its versatility. In the broader context of technical analysis, the Kijun Line is an essential tool for traders aiming to capitalize on market trends, providing valuable data that contribute to effective decision-making in trading environments. The result is then plotted on the chart, providing a smoothing effect that helps filter out market noise and highlight trend direction. The Kijun Line's values can be interpreted in a few ways. When prices are above the Kijun Line, it suggests an upward trend, and conversely, prices below the Kijun Line indicate a downward trend. Additionally, the steepness of the Kijun Line can indicate the trend's strength – a steeper slope suggests a stronger trend. The Kijun Line also produces several trading signals. For instance, a 'Kijun bounce' occurs when the price returns to the Kijun Line before continuing toward the prevailing trend. A 'Kijun break,' on the other hand, happens when the price decisively crosses the Kijun Line, potentially indicating a trend reversal. The Kijun Line is part of the broader Ichimoku Cloud system, which includes four other lines: the Tenkan Line, Senkou Span A, Senkou Span B, and the Chikou Span. These elements together form a comprehensive trading system that provides insights into market trends, momentum, support, and resistance. The relationship between the Kijun Line and the Tenkan Line (Conversion Line) is pivotal to many Ichimoku trading strategies. When the Tenkan Line crosses above the Kijun Line, it produces a bullish signal, and when it crosses below, it generates a bearish signal. These are commonly known as 'TK crossovers.' The Kijun Line's interaction with the 'Cloud,' formed by Senkou Span A and Senkou Span B, also provides crucial market insights. For example, a price breakthrough above the Kijun Line and the Cloud suggests a strong bullish momentum, while a breakthrough below both might indicate a robust bearish momentum. One of the most widely used trading strategies involving the Kijun Line is the TK crossover strategy. In this approach, a trader buys when the Tenkan Line crosses above the Kijun Line and sells when it crosses below. This strategy is simple but effective, providing clear trading signals based on market momentum. Another popular strategy involves trading breakouts when the price crosses the Kijun Line. A bullish breakout occurs when the price moves above the Kijun Line, and a bearish breakout happens when it moves below. Traders often use this strategy with other Ichimoku elements to confirm the signal's strength. The Kijun Line can also be used in a confirmation strategy with the Ichimoku Cloud. Here, a trader might enter a long position when the price is above both the Kijun Line and the Cloud, confirming a strong upward trend. Similarly, they might enter a short position when the price is below both, confirming a strong downward trend. In certain market conditions, the Kijun Line can act as a dynamic support or resistance level, leading to 'bounce' or 'break' phenomena. A 'bounce' refers to price retracing to the Kijun Line and then bouncing off in the direction of the trend. A 'break' refers to the price decisively crossing the Kijun Line, potentially signaling a trend reversal. The Kijun Line's effectiveness can be influenced by market volatility. In highly volatile markets, prices may frequently cross the Kijun Line, potentially leading to false signals. Conversely, in low-volatility markets, the Kijun Line may provide strong support or resistance levels, as prices may be less likely to cross the line. The Kijun Line is also a valuable tool for forecasting future price trends. Traders can assess the slope of the Kijun Line to gauge the potential direction and strength of future trends. A rising Kijun Line may forecast an upcoming bullish trend, while a falling Kijun Line might predict a bearish trend. Compared to traditional moving averages, the Kijun Line offers a few unique advantages. For instance, by averaging the high and low over a given period, it more accurately reflects the full range of price action. Additionally, the Kijun Line is better suited for identifying support and resistance levels, as it considers extreme price points. Bollinger Bands and the Kijun Line both provide information about price volatility. However, while Bollinger Bands adjust their width based on standard deviation, the Kijun Line remains static. This makes the Kijun Line more straightforward to interpret but less responsive to sudden changes in volatility. The RSI and the Kijun Line both identify potential trend reversals, but they do so in different ways. RSI compares the magnitude of recent gains to recent losses to determine overbought or oversold conditions. In contrast, the Kijun Line identifies reversals by tracking when the price crosses the line. Therefore, these two indicators can complementarily provide more robust trading signals. In the stock market, the Kijun Line can be an invaluable tool for identifying potential buy and sell points. Traders can use Kijun Line signals with volume data and other technical indicators to make informed trading decisions. In the Forex market, where macroeconomic events and central bank policies often drive price action, the Kijun Line can help traders cut through the noise and focus on the underlying trend. The Kijun Line can be particularly useful in currency pairs that exhibit strong trending characteristics. In the volatile cryptocurrency market, the Kijun Line provides a much-needed level of stability, allowing traders to identify key support and resistance levels amidst large price swings. Furthermore, the Kijun Line can assist traders in assessing market sentiment, which plays a significant role in cryptocurrency price movements. Like any technical indicator, the Kijun Line is not infallible and can generate false signals. This is particularly true in highly volatile or sideways markets, where prices can frequently cross the Kijun Line without indicating a genuine trend change. In sideways or 'ranging' markets, the Kijun Line may lose some of its predictive power, as it is primarily designed to identify and follow trends. Traders may need to rely on other indicators or adjust their strategies. The effectiveness of the Kijun Line also relies on the availability and accuracy of historical data. While this is not typically a problem in well-regulated markets like stocks or Forex, it can be an issue in newer or less liquid markets, such as certain cryptocurrencies. The Kijun Line is an integral part of the Ichimoku Kinko Hyo system, functioning as a dynamic tool for identifying market trends and signals. Its interplay with other Ichimoku elements forms a comprehensive trading framework, facilitating the insightful interpretation of market dynamics. Key strategies like TK crossover, breakout, and confirmation leverage the Kijun Line's distinct characteristics, providing traders with effective approaches. However, while it shines in certain market conditions, it also encounters limitations, necessitating cautious application. The Kijun Line's integration with advanced technologies and technical tools hints at an exciting future, potentially enhancing its effectiveness. Overall, the Kijun Line stands as an invaluable instrument, equipping traders with substantial market insights and strategic direction in various financial markets.Overview of Kijun Line
Understanding the Technical Construction of the Kijun Line
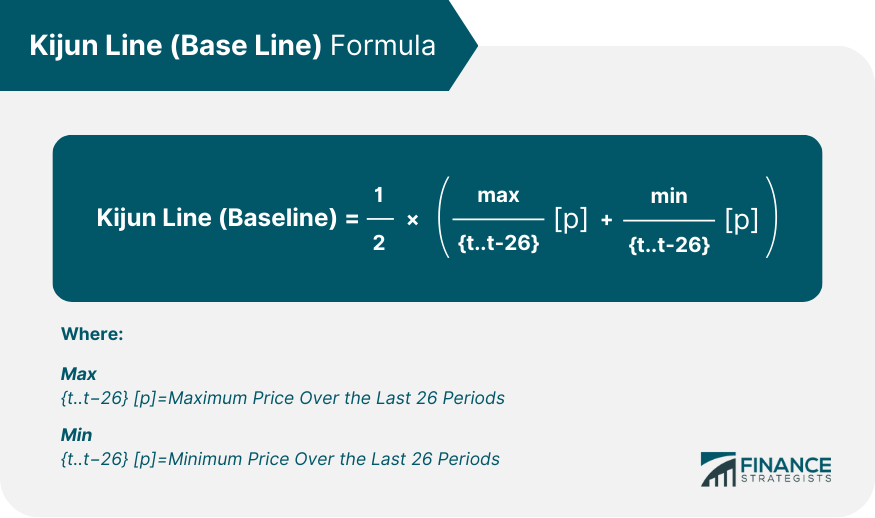
Formula and Calculation
Interpretation of the Values
Key Levels and Signals
Role of the Kijun Line in the Ichimoku Cloud System
Integration With Other Ichimoku Elements
Relationship With Tenkan Line
Interplay With the Cloud (Senkou Span A and B)
Trading Strategies Using the Kijun Line
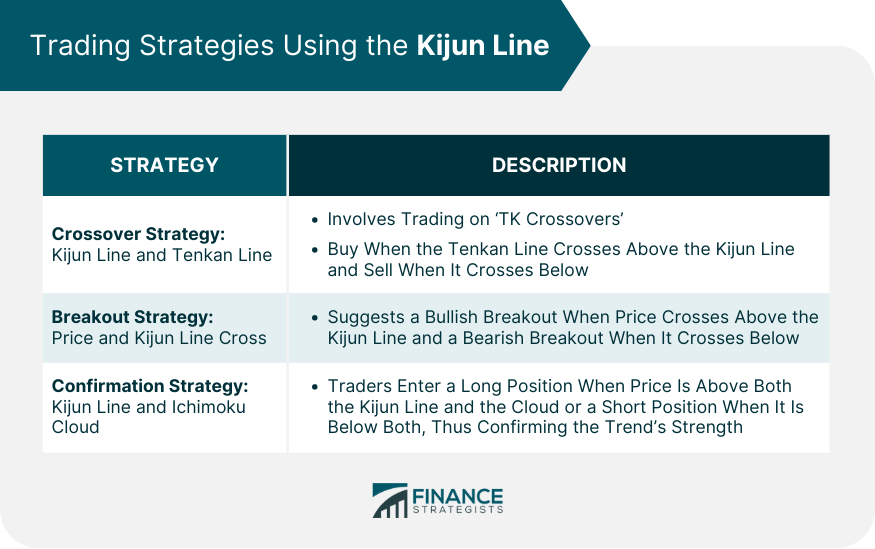
Crossover Strategy: Kijun Line and Tenkan Line
Breakout Strategy: Price and Kijun Line Cross
Confirmation Strategy: Kijun Line and Ichimoku Cloud
Advanced Concepts Associated With the Kijun Line
Bounce and Break Phenomenon
Impact of Volatility
Role in Forecasting Trends
Comparative Analysis of Kijun Line and Other Technical Indicators
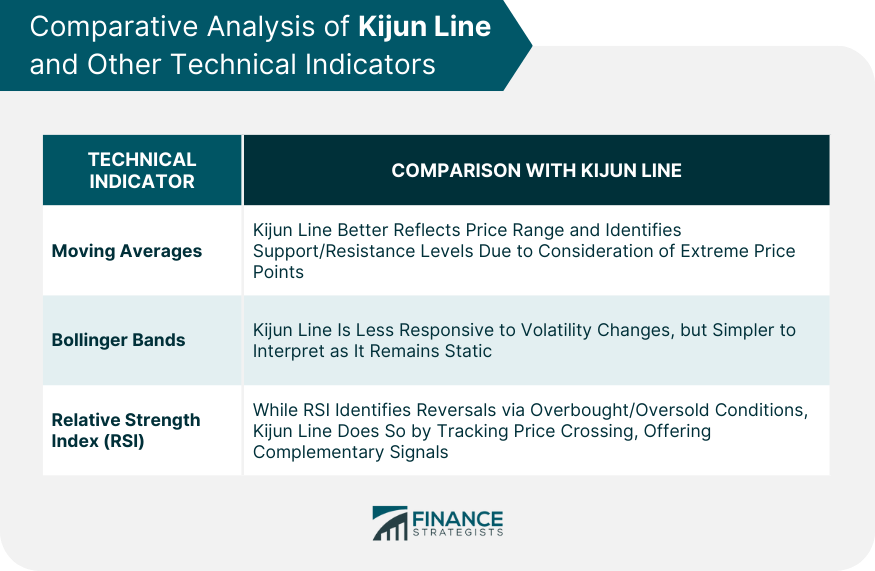
Versus Moving Averages
Versus Bollinger Bands
Versus Relative Strength Index (RSI)
Practical Application of the Kijun Line in Various Financial Markets
Stock Market
Forex Market
Cryptocurrency Market
Challenges and Limitations of the Kijun Line
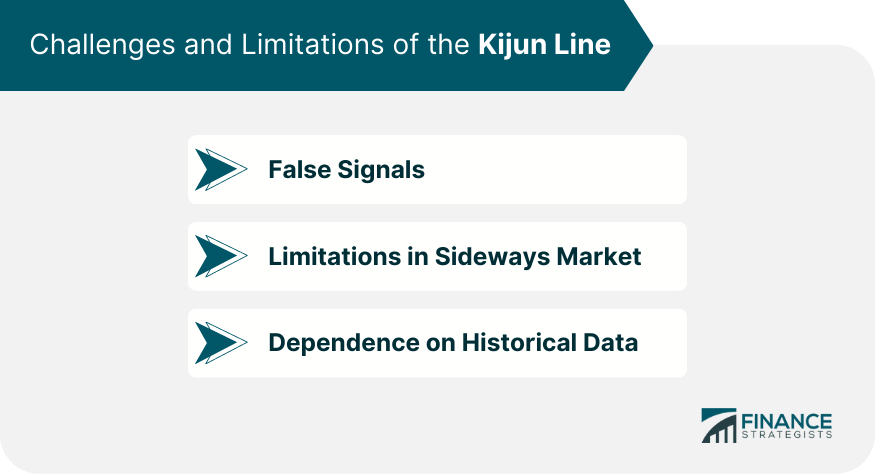
False Signals
Limitations in Sideways Market
Dependence on Historical Data
Final Thoughts
Kijun Line (Base Line) FAQs
The Kijun Line, also known as the Base Line, is a component of the Ichimoku Kinko Hyo indicator, or Ichimoku Cloud. It represents a key reference point for identifying potential areas of support and resistance, assessing market direction, and forming trading strategies. The Kijun Line is calculated by averaging the highest high and the lowest low over a certain period, usually 26 periods.
Traders use the Kijun Line in several ways to formulate trading strategies. For example, they may trade on 'TK crossovers', where the Tenkan Line (another component of the Ichimoku Cloud) crosses the Kijun Line, or they may trade on price breakouts where the price crosses the Kijun Line. The Kijun Line can also be used in combination with the Ichimoku Cloud to confirm strong trends.
The Kijun Line, like a moving average, smooths price action over time. It differs from traditional moving averages by considering the highest high and lowest low, offering a comprehensive view. Unlike the Relative Strength Index (RSI), the Kijun Line identifies trend reversals through price crosses, while the RSI focuses on overbought or oversold conditions. Combining these indicators can enhance a trading strategy.
Like any technical indicator, the Kijun Line is not foolproof and can sometimes generate false signals. This is particularly common in highly volatile or sideways markets. Furthermore, the Kijun Line's effectiveness relies on accurate and comprehensive historical price data, which may not always be available, particularly in less regulated markets like certain cryptocurrencies.
With the rise of AI and machine learning in trading, the Kijun Line can be incorporated into trading algorithms that recognize Kijun Line patterns and incorporate them into their decision-making process, potentially enhancing their predictive power. Future enhancements might also include refining the Kijun Line's calculation to better account for market volatility and developing variations of the Kijun Line suitable for specific market conditions or trading styles.
True Tamplin is a published author, public speaker, CEO of UpDigital, and founder of Finance Strategists.
True is a Certified Educator in Personal Finance (CEPF®), author of The Handy Financial Ratios Guide, a member of the Society for Advancing Business Editing and Writing, contributes to his financial education site, Finance Strategists, and has spoken to various financial communities such as the CFA Institute, as well as university students like his Alma mater, Biola University, where he received a bachelor of science in business and data analytics.
To learn more about True, visit his personal website or view his author profiles on Amazon, Nasdaq and Forbes.


