
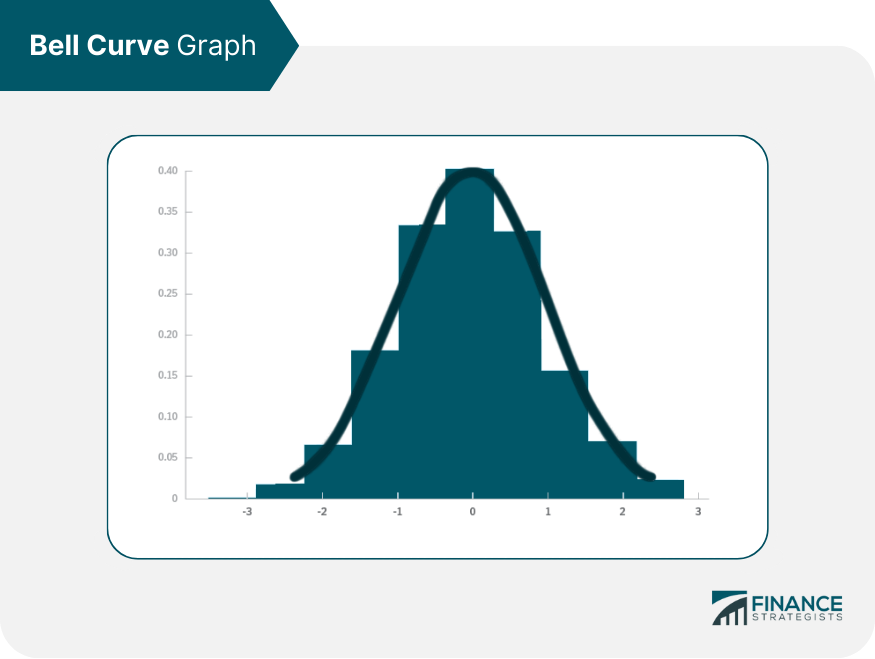
The Bell Curve, also referred to as the Normal Distribution, is a fundamental concept in finance. It characterizes data that clusters around a central or 'mean' value. The graph of the distribution is symmetric and resembles a bell, which is why it's often referred to as a 'Bell Curve.' The curve is defined by two parameters: the mean (average) and the standard deviation (a measure of variation). The concept of the Bell Curve dates back to the 18th century. It was first introduced by mathematician Abraham de Moivre and later formalized by Carl Friedrich Gauss. In the realm of finance, it has been widely adopted as a way to model and manage risk. In financial markets, the Bell Curve serves a crucial function in pricing models, investment strategies, and risk management. It's commonly used to model asset returns, measure risk, and evaluate investment performance. By assuming a normal distribution, financial analysts can make informed predictions about future asset prices and returns. Financial models often assume that asset returns follow a Bell Curve. This assumption implies that returns are equally likely to be above or below the mean, and extreme outcomes are less likely to occur. It simplifies calculations and allows for the use of powerful statistical tools. However, it's worth noting that real-world financial data often deviate from this assumption, which can lead to inaccuracies in model predictions. The mean, or average is the center of the Bell Curve. In financial data, the mean represents the expected return or the average return of an asset over a specific period. The standard deviation is a measure of the dispersion of data. In the Bell Curve, it represents the width of the curve. In financial data, a larger standard deviation indicates higher volatility or risk. Skewness measures the asymmetry of the distribution, while kurtosis measures the 'heaviness' of the tails. In financial data, positive skewness means that returns are more likely to be above the mean, and high kurtosis indicates a higher probability of extreme returns. A Bell Curve is symmetric, and its peak represents the mean, median, and mode of the dataset. The shape of the curve indicates that data near the mean are more frequent in occurrence than data far from the mean. The majority of the data points fall within one standard deviation of the mean, typically 68%, while approximately 95% fall within two standard deviations, and almost 99.7% within three standard deviations. In finance, the Bell Curve model can be used to analyze and interpret the distribution of financial data such as asset prices or returns. It can provide an understanding of the expected returns and their associated risks. By applying the Bell Curve to financial data, analysts can predict the likelihood of different outcomes. One crucial aspect of the Bell Curve in finance is that the area under the curve represents the probability of a particular outcome occurring. This probability interpretation allows investors and analysts to predict the range within which they can expect returns. Under a normal distribution, the highest point on the curve represents the mean value, which has the highest probability of occurring. This suggests that, in most instances, the returns from an asset will be close to the mean. It is why the mean is considered a significant figure in finance and is often used to estimate future returns. Values that are farther from the mean, either above or below, represent less probable outcomes. These outliers signify events of substantial gain or loss. Despite their lower probability, these outliers can have significant impacts and are therefore the focus of risk management strategies. The Bell Curve plays a critical role in risk measurement. Financial analysts use it to calculate Value-at-Risk (VaR), a widely-used risk metric that estimates the potential loss of an investment portfolio over a certain period at a given confidence level. VaR uses the Bell Curve to predict the worst-case scenario for an investment over a specified time period. For instance, a VaR of $1 million at a 95% confidence level means that there's a 5% chance that the portfolio will lose more than $1 million over the given period. Modern Portfolio Theory (MPT) is a framework for constructing portfolios to maximize return for a given level of risk. MPT assumes that asset returns are normally distributed, which enables the use of the Bell Curve to quantify risk and optimize portfolio allocations. The Capital Asset Pricing Model (CAPM) uses the Bell Curve to determine the expected return on an investment, given its risk relative to the market. The model assumes that the distribution of returns for the market and the individual asset are both normal. Despite its widespread use, the Bell Curve has been criticized for its oversimplification of financial markets. Critics argue that financial data often exhibit skewness and kurtosis, indicating that returns aren't symmetric and extreme events occur more frequently than the Bell Curve predicts. These limitations were highlighted during the 2008 financial crisis when many financial models based on the Bell Curve failed to predict the scale of the market crash. Assuming a normal distribution of financial data can lead to an underestimation of risk and potential financial losses. Financial data often exhibit 'fat tails,' implying that extreme events are more likely than what the Bell Curve predicts. This can lead to significant deviations from model predictions, leading to potential financial losses. Given the limitations of the Bell Curve, financial analysts have explored alternatives. These include non-normal distributions, such as the Student's t-distribution and the Cauchy distribution, which are more capable of capturing the 'fat tails' often observed in financial data. Beyond non-normal distributions, there are other financial models that don't rely on the Bell Curve. These include models based on stochastic volatility, jump diffusion, and heavy-tailed distributions. These models can provide a more accurate representation of financial market dynamics and help in better risk management. The Bell Curve has significantly influenced financial regulation. Regulatory frameworks, such as the Basel Accords, use concepts derived from the Bell Curve to determine risk-weighted assets and set capital requirements for banks. The Basel Accords, a set of international banking regulations, employ the Bell Curve in their internal models to calculate market risk and set capital requirements. The Accords have been critiqued for their reliance on the Bell Curve, particularly in light of the 2008 financial crisis. The Bell Curve, a pivotal concept in finance, signifies a statistical distribution where the majority of data points cluster around a central or mean value. Its symmetric shape has been foundational in financial analysis, modeling market dynamics, and guiding risk management strategies. Crucially, interpreting the Bell Curve in finance requires an understanding of its key components: the mean, standard deviation, and the measures of skewness and kurtosis. Despite criticisms related to the assumption of normal distribution in financial data, the Bell Curve remains an indispensable tool for financial professionals capable of guiding the navigation of complex financial markets. The comprehension of this model offers profound insights into market dynamics, enabling better prediction, risk measurement, and strategic investment decision-making. As we move forward, the enduring relevance of the Bell Curve will continue to shape the landscape of financial analysis and risk management.Definition of the Bell Curve
Bell Curve and Financial Markets
Importance in Financial Analysis
Basic Assumptions in Financial Models
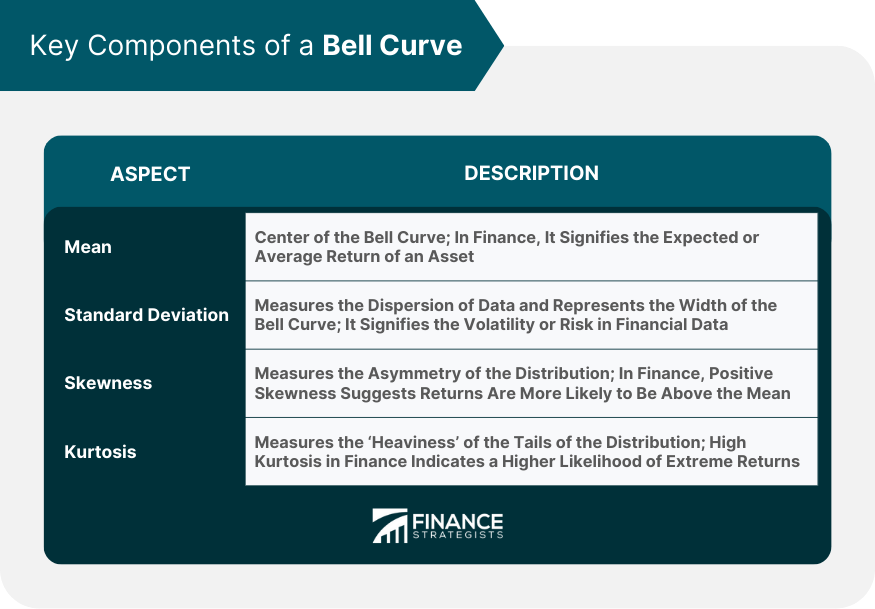
Key Components of a Bell Curve
Mean
Standard Deviation
Skewness and Kurtosis
Interpretation of the Bell Curve Shape
Bell Curve and Financial Data
Probability of a Particular Outcome
Mean Value and Its Significance
Understanding Outliers
Bell Curve and Risk Management
Use in Risk Measurement
Application in Value-at-Risk (VaR)
Bell Curve in Portfolio Theory
Role in Modern Portfolio Theory (MPT)
Application in Capital Asset Pricing Model (CAPM)
Limitations of the Bell Curve in Finance
Criticisms and Challenges
Issues With Assumption of Normal Distribution
Bell Curve Alternatives in Finance
Non-normal Distributions
Other Financial Models Not Relying on the Bell Curve
Bell Curve and Financial Regulation
Impact on Regulatory Policies
Influence on Basel Accords
Final Thoughts
Bell Curve FAQs
The Bell Curve in finance is a statistical distribution used to model financial data such as asset returns. It's a symmetric distribution where most observations cluster around the central mean value, and fewer observations lie farther from the mean.
In risk management, the Bell Curve is used to measure and predict risk. A common application is the calculation of Value-at-Risk (VaR), a metric that estimates the potential loss of an investment portfolio over a certain period at a specific confidence level.
The main limitations of the Bell Curve in finance are its assumptions of symmetry and light-tailed distribution. Real-world financial data often shows skewness and 'fat tails,' suggesting that extreme events occur more frequently than the Bell Curve predicts. This can lead to an underestimation of risk.
Alternatives to the Bell Curve in finance include non-normal distributions like the Student's t-distribution and the Cauchy distribution, which can better handle 'fat tails' in financial data. Other financial models that don't rely on the Bell Curve include models based on stochastic volatility and jump-diffusion.
The Bell Curve faces criticism in finance due to its assumptions of symmetry and light-tailed distribution. In reality, financial data often show skewness and 'fat tails', suggesting that extreme events are more common than the Bell Curve anticipates, potentially leading to risk underestimation.
True Tamplin is a published author, public speaker, CEO of UpDigital, and founder of Finance Strategists.
True is a Certified Educator in Personal Finance (CEPF®), author of The Handy Financial Ratios Guide, a member of the Society for Advancing Business Editing and Writing, contributes to his financial education site, Finance Strategists, and has spoken to various financial communities such as the CFA Institute, as well as university students like his Alma mater, Biola University, where he received a bachelor of science in business and data analytics.
To learn more about True, visit his personal website or view his author profiles on Amazon, Nasdaq and Forbes.


