
The Aroon Oscillator is a technical analysis tool that's used to measure the strength of a trend and predict its potential reversals. It's calculated by subtracting the Aroon Down indicator from the Aroon Up indicator. These two indicators track the time it takes for the price to reach the highest and lowest points over a given time period, usually 25 days. The resulting Aroon Oscillator value fluctuates between -100 and +100. Positive values indicate an upward price trend (bullish), while negative values suggest a downward price trend (bearish). Introduced in 1995 by finance expert Tushar Chande, the Aroon Oscillator is a key tool in technical analysis, designed to measure trend strength and predict reversals. Deriving its name from the Sanskrit term 'Aruna,' it symbolizes the onset of new market trends. This oscillator assists in formulating trading strategies by identifying trending securities and forecasting potential price changes, thus enhancing investment decision-making. The Aroon Oscillator is the difference between Aroon Up and Aroon Down. Aroon Up measures the strength of an uptrend, while Aroon Down measures the strength of a downtrend. The values for both indicators range from 0 to 100. A high Aroon Up combined with a low Aroon Down signifies a strong upward trend. Conversely, a low Aroon Up with a high Aroon Down indicates a strong downward trend. The Aroon Oscillator line is derived by subtracting the Aroon Down from the Aroon Up. It fluctuates between -100 and +100. A positive value indicates an upward trend, while a negative value signifies a downward trend. The oscillator's zero line plays a crucial role, with crossovers serving as potential trade signals. The key levels on the Aroon Oscillator are the +50, -50, and 0 marks. If the oscillator is above +50, it's an indication of a strong bullish trend, while a value below -50 signifies a strong bearish trend. The zero crossover point can provide potential buy or sell signals. An upward crossover (from negative to positive) might suggest a buy signal, while a downward crossover (from positive to negative) may indicate a sell signal. The Aroon Oscillator is calculated using the formula: To calculate the Aroon Up and Aroon Down, you'll need to identify the periods since the highest high and lowest low within a predetermined time frame. Here's how to calculate the Aroon Oscillator in four steps: 1. Choose a predetermined period, typically 25 periods. 2. Identify the period with the highest high and calculate Aroon Up: ((25 - Periods since 25-period high) / 25) x 100 3. Identify the period with the lowest low and calculate Aroon Down: ((25 - Periods since 25-period low) / 25) x 100 4. Subtract Aroon Down from Aroon Up to get the Aroon Oscillator. Let's consider a stock over a 25-day period. Suppose the highest high occurred 5 days ago, and the lowest low happened 20 days ago. The positive Aroon Oscillator suggests that the stock is in a strong uptrend. Positive values of the Aroon Oscillator indicate bullish market behavior as the price is making new highs within the chosen period, while negative values suggest bearish market behavior because the price is making new lows. The further away the oscillator is from the zero line (either positively or negatively), the stronger the trend. The crossover points of the oscillator with the zero line often indicate trend reversals. When the oscillator moves from below zero to above, it could signal a bullish reversal. When it crosses from above zero to below, it might suggest a bearish reversal. Extreme values, i.e., close to +100 or -100, suggest a very strong trend. If the oscillator reaches +100, it indicates that the price is regularly achieving new highs. Conversely, if it touches -100, it signifies the price is continuously marking new lows. The Aroon Oscillator's zero line crossovers provide potential buy and sell signals. When the oscillator moves from below zero to above, it could be a buy signal, and when it crosses from above to below, it might be a sell signal. However, these signals should be confirmed with other technical analysis tools. Divergence happens when the price and the Aroon Oscillator are moving in opposite directions, which could signal a potential trend reversal. Convergence occurs when the price and the oscillator move in the same direction, reinforcing the current trend. The Aroon Oscillator is often used with other technical indicators for confirmation. For example, traders might use the Aroon Oscillator alongside the Relative Strength Index (RSI) or Moving Average Convergence Divergence (MACD) to increase the reliability of trading signals. The Aroon Oscillator is excellent at identifying trends and their strength, providing valuable information for traders. It's particularly effective in markets that trend significantly, either upward or downward. Its simplicity also makes it accessible to both novice and experienced traders. However, like all indicators, the Aroon Oscillator isn't flawless. It may generate false signals in a range-bound market. Moreover, relying solely on this oscillator without considering other market factors or indicators could lead to inaccurate conclusions. Compared to other trend-following indicators like the Moving Average Convergence Divergence (MACD), the Aroon Oscillator is specifically designed to gauge trend strength and spot potential reversals. It might give quicker signals compared to indicators that use moving averages, which can lag the price action. With the rise of algorithmic trading, the Aroon Oscillator is often incorporated into automated trading systems. The clear mathematical calculation and the oscillator's ability to generate objective trading signals make it well-suited for automated trading strategies. In risk management, the Aroon Oscillator helps traders set stop-loss levels by identifying trend reversals. Moreover, in asset allocation, the oscillator can assist in identifying trending assets to include in a portfolio. The Aroon Oscillator is a powerful tool in technical analysis, aiding in understanding market trends and their strength. Calculation of this indicator involves two separate measures, Aroon Up and Aroon Down, derived from the periods since the highest and lowest price points within a certain timeframe, typically 25 days. Subtracting Aroon Down from Aroon Up gives us the Aroon Oscillator value, which oscillates between -100 and +100. Interpretation of this oscillator involves recognizing that positive values signify an uptrend or bullish market, whereas negative values indicate a downtrend or bearish market. Furthermore, trend reversals can be anticipated through zero-line crossovers, providing valuable trading signals. In essence, the Aroon Oscillator offers substantial insights into the direction and intensity of market trends, thereby equipping traders with well-informed decision-making.Aroon Oscillator Definition
Understanding the Aroon Oscillator
Aroon Up and Aroon Down
Aroon Oscillator Line
Key Levels and Signals
Calculating the Aroon Oscillator
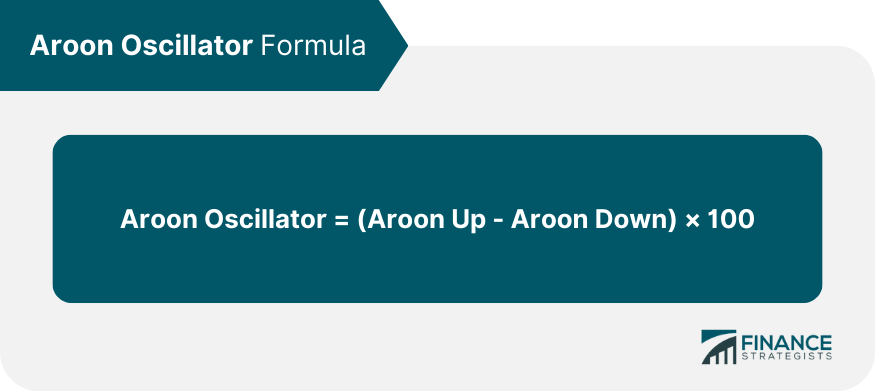
Formula
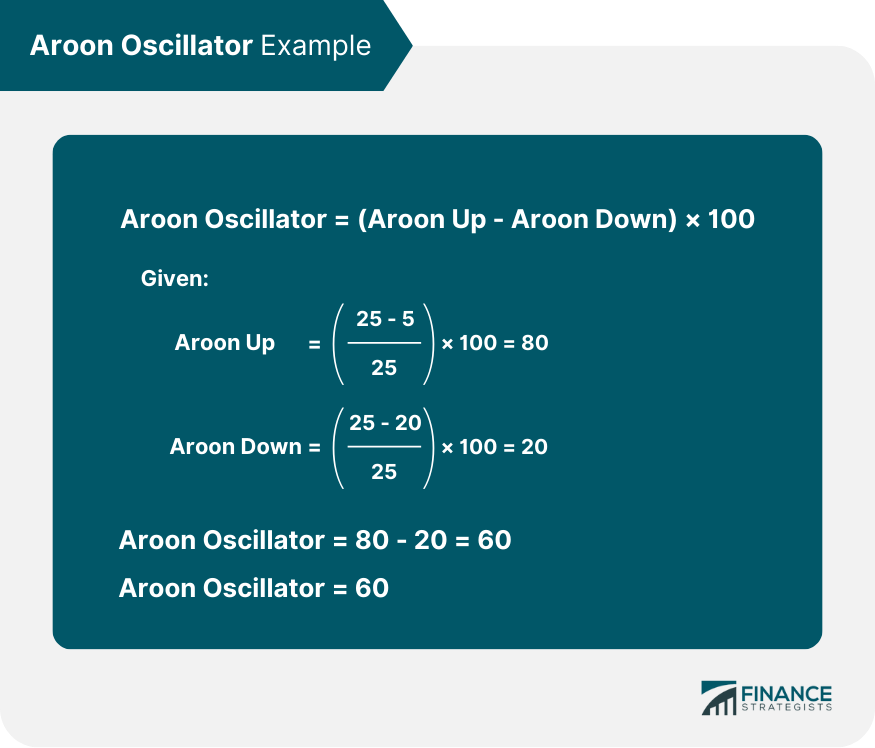
Step-by-Step Calculation Process
Example Calculations
Interpreting the Aroon Oscillator
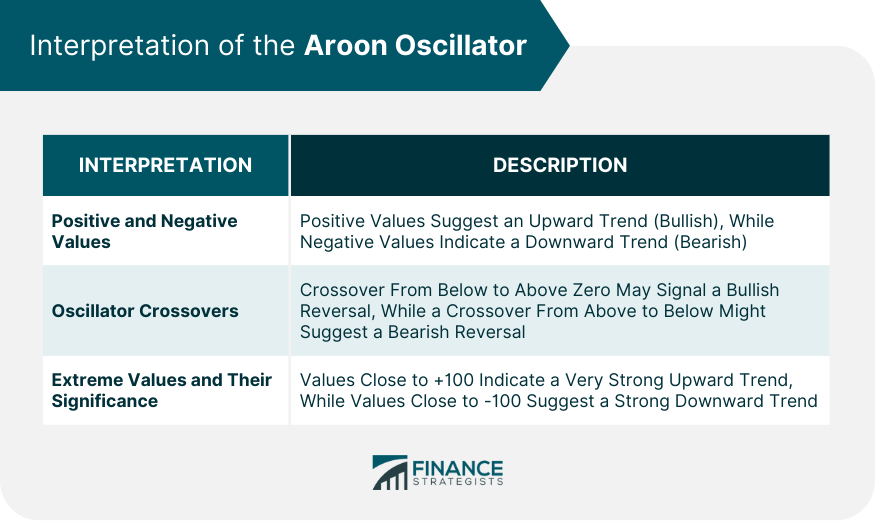
Positive and Negative Values
Oscillator Crossovers
Extreme Values and Their Significance
Aroon Oscillator in Trading
Using the Oscillator for Buy and Sell Signals
Divergence and Convergence
Combining the Oscillator With Other Indicators
Advantages and Limitations of the Aroon Oscillator
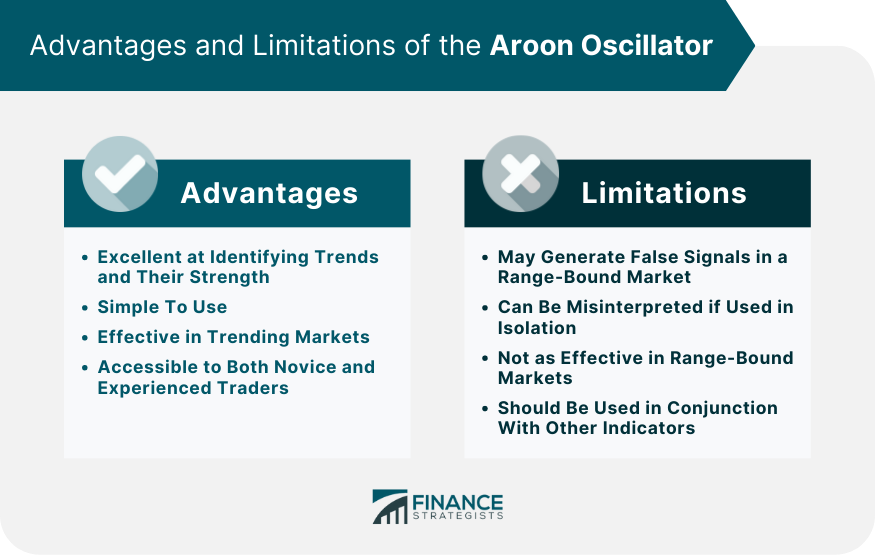
Strengths of the Oscillator
Potential Drawbacks and Misinterpretations
Comparisons With Other Technical Indicators
Aroon Oscillator in Modern Trading Systems
Incorporation Into Automated Trading Systems
Role in Risk Management and Asset Allocation
Conclusion
Aroon Oscillator FAQs
The Aroon Oscillator is a technical analysis tool that measures the strength of a trend and predicts potential reversals. It's important in trading as it provides insights into market behavior, helping traders make informed decisions.
The Aroon Oscillator is calculated by subtracting the Aroon Down indicator from the Aroon Up indicator. These indicators track the time it takes for the price to reach the highest and lowest points over a given time period, typically 25 days.
Positive values of the Aroon Oscillator indicate an upward price trend (bullish), while negative values suggest a downward price trend (bearish).
The Aroon Oscillator can help anticipate trend reversals through its crossovers with the zero line. When the oscillator crosses from below zero to above, it may indicate a bullish reversal, while crossing from above to below might suggest a bearish reversal.
Although the Aroon Oscillator is effective in trending markets, it may generate false signals in a range-bound market. Therefore, it's recommended to use it in combination with other technical analysis tools for more accurate trading signals.
True Tamplin is a published author, public speaker, CEO of UpDigital, and founder of Finance Strategists.
True is a Certified Educator in Personal Finance (CEPF®), author of The Handy Financial Ratios Guide, a member of the Society for Advancing Business Editing and Writing, contributes to his financial education site, Finance Strategists, and has spoken to various financial communities such as the CFA Institute, as well as university students like his Alma mater, Biola University, where he received a bachelor of science in business and data analytics.
To learn more about True, visit his personal website or view his author profiles on Amazon, Nasdaq and Forbes.


