
The par yield curve represents the coupon rate that makes a bond's price equal to its face value or par value. It's the yield curve for coupon-bearing bonds issued at par, making them valuable for assessing the market's interest rate expectations. In financial markets, the par yield curve is instrumental for investors and financial institutions to gauge the economy's health, anticipate interest rate movements, and guide strategic investment decisions. While the par yield, spot yield, and forward yield curves are fundamental in assessing interest rates, they each serve distinct functions. The spot yield curve presents the yields of zero-coupon bonds maturing at different times. The forward yield curve depicts expected future short-term rates, while the par yield curve represents yields of coupon-bearing bonds issued at par. This includes analyzing whether the curve is upward-sloping (normal), downward-sloping (inverted), or flat. Additionally, it involves examining the steepness or flatness of different sections of the curve, such as the short-term or long-term interest rates. It involves analyzing the specific interest rates or yields associated with different time horizons, such as 1-year, 5-year, or 10-year maturities. This is the specific numerical values of yields at different points along the curve. This includes interpreting the curve in relation to anticipated future interest rate changes, inflation expectations, and overall economic outlook. It involves analyzing how the curve reflects market sentiment and expectations for future monetary policy or economic events. Several factors influence the shape and level of the par yield curve: Central banks' current short-term interest rates significantly impact the yield curve. The market's expectations about future economic conditions are critical in shaping the yield curve. The supply and demand dynamics of bonds in the market can also affect the yield curve. Constructing a par yield curve involves multiple steps: Data Collection: The first step is collecting the necessary data, including the coupon rates, prices, and maturities of a wide range of government or corporate bonds. These bonds should be risk-free or of similar credit quality. Bootstrapping: The next step is to use a bootstrapping method to derive spot rates from the collected data. Bootstrapping is a process where the yield of each bond is solved iteratively, starting from the shortest maturity bond and moving to longer maturities. The yield of each bond is calculated in a way that its present value, discounted at the derived spot rates for each cash flow, equals its market price. Plotting the Curve: Once the spot rates for various maturities have been calculated, they are plotted on a graph with maturities on the x-axis and yields on the y-axis. The resulting plot is the par yield curve. Constructing a par yield curve involves some degree of estimation and interpolation, especially for maturities where there are no exact corresponding bonds in the market. The constructed par yield curve provides a crucial tool for pricing, valuation, and risk assessment in financial markets. An upward-sloping par yield curve, also known as a normal yield curve, indicates that long-term interest rates are higher than short-term rates. This is the most common type of yield curve and signifies a healthy, growing economy. The rationale behind this slope is primarily linked to the risk-return trade-off. Investors demand a higher yield for holding long-term bonds, which are subject to increased market risk due to uncertainties over a more extended period. This risk includes changes in interest rates, inflation, and economic cycles that could negatively impact the bond's value. An upward-sloping curve reassures investors, suggesting that the economy will continue to grow and that future cash flows from long-term investments will be valued highly. Conversely, a downward-sloping curve, or an inverted yield curve, happens when long-term rates are lower than short-term rates. This unusual situation is often seen as a harbinger of economic recession. The curve's inversion means investors expect interest rates to fall in the future, typically due to a slowdown in economic growth or even a contraction. The lower long-term rates can be understood as investors' willingness to accept lower yields for long-term bonds in anticipation of lower rates in the future. Economists and market participants closely monitor such inversion in the yield curve, as it has reliably predicted past recessions. A flat yield curve is a rarity and typically suggests a transitional economic phase. When the yield curve is flat, it implies that long-term rates are nearly equal to short-term rates. This can happen when the market transitions from normal to inverted yield curves or vice versa. The flattening of the curve can result from changes in economic expectations. For instance, if short-term interest rates are rising faster than long-term rates, it might suggest that the market expects rates to be higher in the future. Alternatively, if long-term rates fall faster than short-term rates, it could signal a future economic slowdown. Therefore, a flat yield curve often signals uncertainty in the market and an economic change on the horizon. The par yield curve is directly related to the bond coupon rates. When pricing a bond, the coupon rate—the interest paid by the bond issuer to the bondholder—is critical. By definition, if a bond's coupon rate equals the yield at its maturity point on the par yield curve, it is priced at its face or par value. For example, if the yield for a 10-year bond on the par yield curve is 5%, a 10-year bond issued with a 5% coupon rate would be priced at par. If the coupon rate were higher than the yield on the par yield curve, the bond would be priced at a premium. If it were lower, the bond would be priced at a discount. The par yield curve is a fundamental tool in bond valuation. In bond pricing, the future cash flows—coupon payments and principal repayment at maturity—need to be discounted back to their present value. The discount rate used for this calculation is typically derived from the yield curve. The corresponding yield on the par yield curve for each future cash flow provides the discount rate. The par yield curve is crucial in pricing interest rate derivatives, such as interest rate swaps and bond options. In interest rate swaps, for example, the fixed rate paid over the swap's life is often set close to the corresponding yield on the par yield curve at the inception of the swap contract. Thus, the shape and level of the par yield curve can significantly influence the valuation and pricing of such derivatives. In the field of risk management, a par yield curve is an essential tool for evaluating and mitigating interest rate risk. Interest rate risk refers to the potential for investment losses due to a change in interest rates. For instance, bond prices fall when rates rise, leading to significant losses for bondholders. Risk managers use the par yield curve to anticipate potential shifts in interest rates. For example, an upward-sloping par yield curve may signal rising rates, suggesting a potential risk for bondholders. Conversely, a flat or inverted yield curve might indicate lowering rates or economic downturns, presenting different risks. Risk managers can devise hedging strategies to mitigate interest rate risk based on these assessments. These include diversifying bond portfolios across different maturities or using interest rate derivatives, such as swaps or options. Investors also use the par yield curve to formulate investment strategies. The shape and level of the curve can influence decisions regarding bond portfolio allocation. For example, an upward-sloping yield curve might encourage investors to "ladder" their bond portfolio, i.e., diversify their investments across bonds with different maturities to balance risk and return. The par yield curve also aids in duration targeting. Duration measures a bond's price sensitivity to changes in interest rates. By analyzing the yield curve, investors can choose bonds with durations that align with their interest rate outlook and risk tolerance. The par yield curve is a benchmark for evaluating different fixed-income securities. Investors can assess their relative value and attractiveness by comparing the yields of various securities to the par yield curve. For example, a corporate bond that offers a higher yield than the corresponding point on the par yield curve might indicate a good investment opportunity, assuming equal credit risk. A bond yielding less than the curve might suggest it's overpriced. Thus, the par yield curve helps investors make informed decisions and optimize their fixed-income investments. Interest rate swaps are derivative contracts where two parties agree to exchange interest rate payments over a predetermined period. Typically, one party agrees to make payments based on a fixed interest rate, and the other makes payments based on a floating rate, which is usually linked to a reference rate such as the London Interbank Offered Rate (LIBOR) or the Secured Overnight Financing Rate (SOFR). The principal amount on which these payments are calculated, also known as the notional principal, is the same for both parties but does not change hands. Interest rate swaps are commonly used by corporations, financial institutions, and investors to manage interest rate risk or speculate on interest rate changes. The par yield curve plays a crucial role in pricing interest rate swaps. When initiating a swap contract, the fixed rate to be paid over the swap's life is often set close to the yield corresponding to the swap's maturity on the par yield curve. For example, if the yield on a 5-year par yield curve is 3%, a typical 5-year interest rate swap would have a fixed rate close to this yield. Consequently, if the par yield curve shifts, the market prices of interest rate swaps would adjust accordingly. The relationship between the par yield curve and interest rate swaps extends further into risk management strategies. Financial institutions often use swaps to hedge against changes in the par yield curve, managing the interest rate risk of their bond portfolios. Therefore, understanding the dynamics between the par yield curve and interest rate swaps is vital for investors and financial professionals dealing with interest rate risk management and derivative pricing. While the par yield curve is a vital tool in financial markets, it's based on several theoretical assumptions that might not hold true in real-world markets: The construction of the par yield curve assumes that there are no arbitrage opportunities. However, in the actual financial markets, arbitrage opportunities can occasionally arise due to factors such as transaction costs, regulatory constraints, or market inefficiencies. The par yield curve often assumes continuous compounding of interest. This assumption simplifies calculations but might not reflect the reality of discrete compounding periods in many financial instruments. The par yield curve is typically derived under the assumption of risk-neutral investors. This assumes that investors only care about expected returns, not the associated risk, which is only sometimes the case in real-world investing scenarios. The par yield curve assumes that all market participants have the same expectations about future interest rates. Investors often have different views on future interest rates and economic conditions. The par yield curve, representing the yield of bonds issued at par, serves a significant role in financial markets. It is critical in bond pricing, risk management, and strategic investment decisions. Despite its limitations, the par yield curve remains an indispensable tool for investors and financial institutions. In an ever-evolving financial landscape, the importance of the par yield curve is likely to grow. As economic indicators and monetary policies change, the curve will continue to provide valuable insights into future interest rate movements and the economy's health. Understanding and leveraging the insights provided by the par yield curve can be pivotal in making sound financial decisions. Engage a wealth management advisor to navigate this complex landscape and maximize your investment potential.Overview of Par Yield Curve
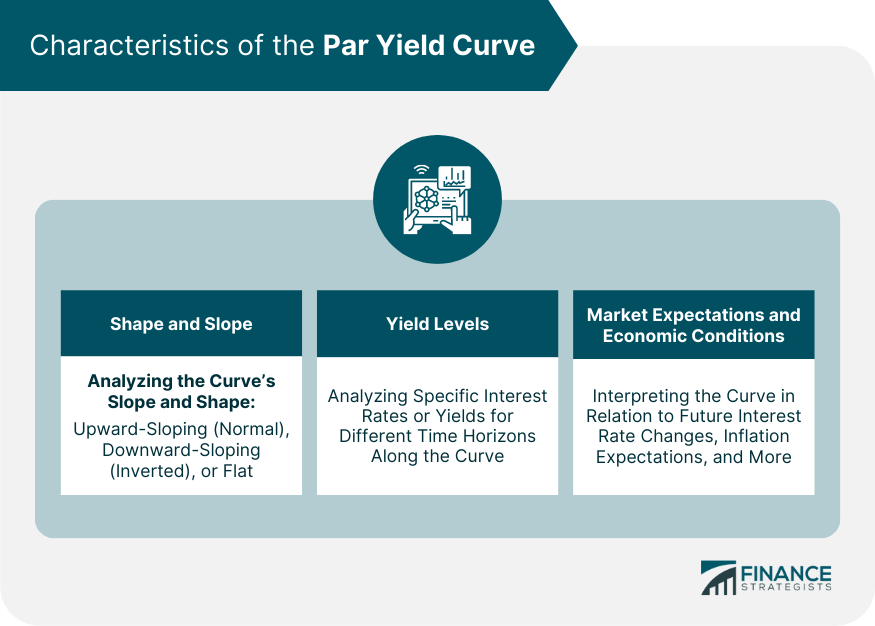
Characteristics of the Par Yield Curve
Shape and Slope
Yield Levels
Market Expectations and Economic Conditions
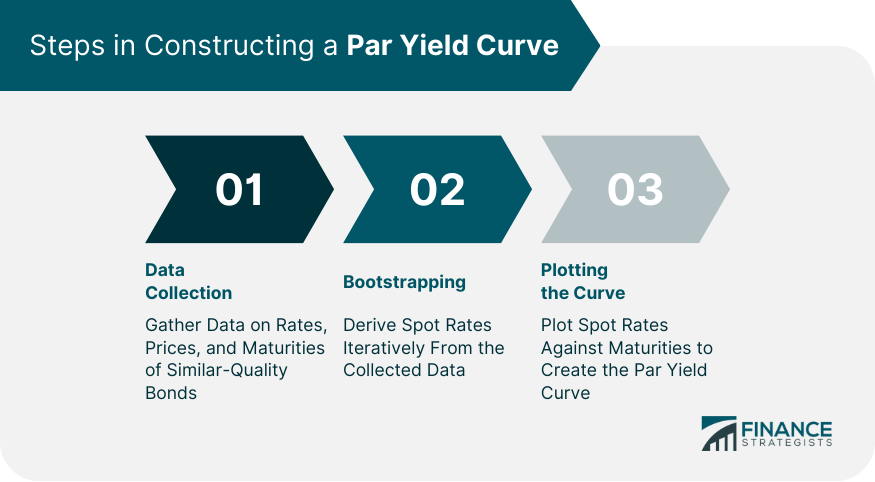
Construction of the Par Yield Curve
Determinants for the Curve
Prevailing Interest Rates
High-interest rates usually make newly issued bonds more attractive than existing ones, pushing the yields of existing bonds up and leading to an upward-sloping curve.Economic Expectations
If the market expects the economy to grow, long-term interest rates usually rise due to the anticipated increase in inflation, leading to an upward-sloping curve. Conversely, expectations of an economic downturn may lead to a flat or inverted yield curve.Demand-Supply Dynamics
If there is a high demand for long-term bonds, their prices will rise, decreasing long-term yields and potentially resulting in a downward-sloping curve.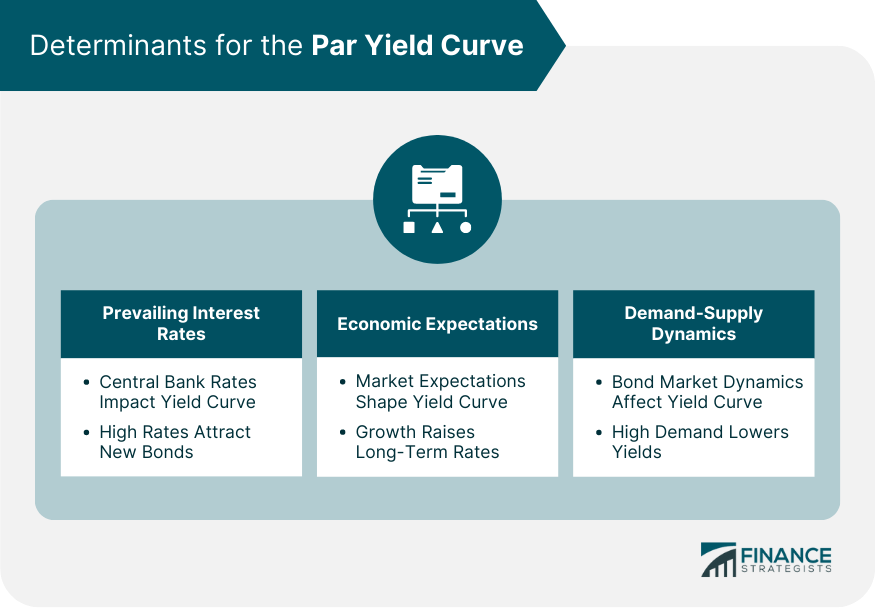
Step-By-Step Process
Interpreting the Par Yield Curve
Upward Sloping Curve
Downward Sloping Curve
Flat Curve
Importance of the Par Yield Curve in Bond Pricing
Relation to Coupon Rates
Use in Valuation of Bonds
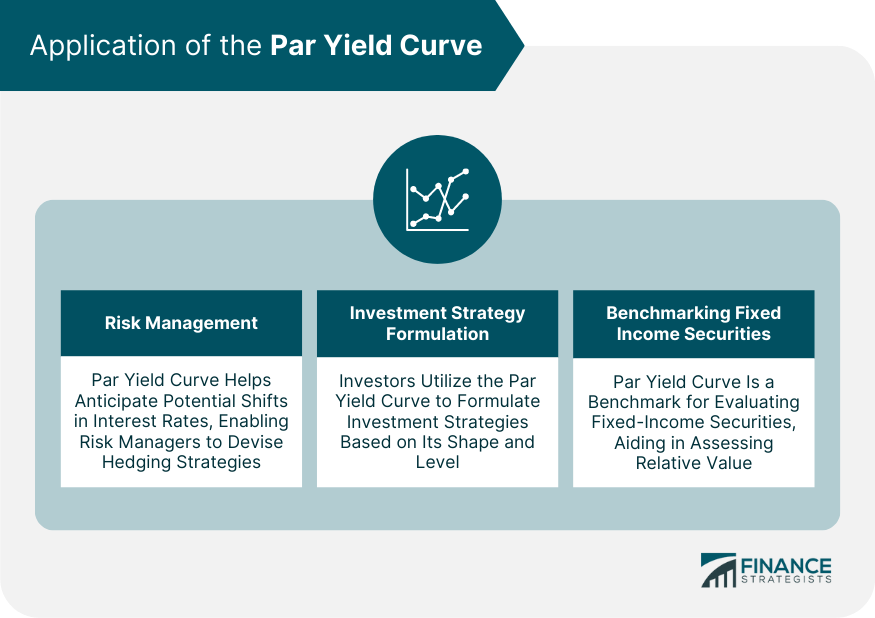
Application of the Par Yield Curve
Risk Management
Investment Strategy Formulation
Benchmarking Fixed Income Securities
Par Yield Curve and Interest Rate Swaps
Defining Interest Rate Swaps
Connection With the Par Yield Curve
Limitations of the Par Yield Curve
Assumptions and Constraints
Absence of Arbitrage Opportunities
Continuous Compounding
Risk Neutrality
Homogeneous Expectations
Final Thoughts
Par Yield Curve FAQs
An upward-sloping par yield curve suggests that long-term interest rates are higher than short-term rates, indicating economic expansion.
The spot yield curve represents the yields of zero-coupon bonds maturing at different times, while the par yield curve represents yields of coupon-bearing bonds issued at par.
The par yield curve is used in bond pricing by providing the discount rates for future cash flows. If a bond's coupon rate equals the yield at its maturity on the par yield curve, the bond is priced at par.
In interest rate swaps, the fixed rate is often set close to the corresponding yield on the par yield curve, making it instrumental in pricing these derivative contracts.
Yes, the par yield curve can turn negative in certain economic scenarios, such as during deflation or heightened economic uncertainty. This implies that investors are willing to pay to hold bonds rather than being paid.
True Tamplin is a published author, public speaker, CEO of UpDigital, and founder of Finance Strategists.
True is a Certified Educator in Personal Finance (CEPF®), author of The Handy Financial Ratios Guide, a member of the Society for Advancing Business Editing and Writing, contributes to his financial education site, Finance Strategists, and has spoken to various financial communities such as the CFA Institute, as well as university students like his Alma mater, Biola University, where he received a bachelor of science in business and data analytics.
To learn more about True, visit his personal website or view his author profiles on Amazon, Nasdaq and Forbes.


