
A Spinning Top Candlestick is a type of Japanese candlestick charting pattern that traders use to analyze price behavior in financial markets. It's characterized by a small body situated between long upper and lower wicks. The small body reflects a narrow range between the open and close prices, while the long wicks suggest a larger range between the highest and lowest prices during the trading period. The Spinning Top's distinctive shape visualizes a tug-of-war between buyers and sellers. Neither party gained the upper hand during the trading session, resulting in a standoff symbolized by the candlestick's small body and long wicks. In wealth management, the Spinning Top Candlestick pattern holds considerable significance due to its ability to provide signals about potential reversals in the market. A Spinning Top represents indecision in the market, a standoff between buyers and sellers. This uncertainty can frequently precede a reversal in trend, making the Spinning Top a critical tool for anticipating future price movements. Moreover, the Spinning Top Candlestick can serve as a tool to reassess current investment positions. If an investor observes a Spinning Top forming after a prolonged uptrend or downtrend, they might consider it a sign to potentially exit or hedge their position, protecting their portfolio from a possible market reversal. One of the key characteristics of a Spinning Top Candlestick is the combination of its small body and long wicks. The body, representing the range between the opening and closing prices, is distinctly small, signifying little price movement. However, the long upper and lower wicks show a wide range of prices were tested during the trading session. This disparity between the body and wick lengths captures a period of indecision in the market. While the market explored a broad range of prices, by the close of trading, neither buyers nor sellers managed to secure a significant price move. In a Spinning Top Candlestick, the open and close prices are relatively close together, leading to the formation of a small body. The closeness of these prices indicates a balance between the buying and selling pressures. Despite the price swings during the session, the market essentially closed near where it opened. The close proximity of the open and close prices, along with the long wicks, highlights the uncertainty prevailing in the market. It suggests that the forces of supply and demand are nearly balanced, possibly indicating a trend change on the horizon. The Spinning Top Candlestick is unique in that its color, whether it's a bullish green or a bearish red, does not hold significant importance. This indifference towards the candlestick's color underscores the pattern's primary implication of market indecision. However, the overall shape of the Spinning Top is critical. A small body centered between long upper and lower wicks is the distinguishing feature of this candlestick pattern. This structure embodies a market in which neither the bulls nor the bears could maintain control, suggesting a potential shift in power may soon occur. The Spinning Top Candlestick embodies market indecision, a period where the sentiment is balanced between buyers and sellers. The long wicks on both ends of the candlestick indicate that both buyers and sellers had their moments during the session, but neither could sustain their advantage, resulting in a small body. Market indecision, while showing a lack of clear direction, can often precede significant moves in the market. Thus, a Spinning Top can serve as a valuable tool for traders, alerting them to possible upcoming shifts in market sentiment and direction. Although a single Spinning Top Candlestick indicates market indecision, when it appears after a prolonged uptrend or downtrend, it can signal a potential trend reversal. This potential reversal is based on the premise that the Spinning Top reflects a balance between buyers and sellers—a balance that might sway towards the opposite side, reversing the ongoing trend. The Spinning Top does not guarantee a trend reversal. Traders often look for additional confirmation, such as a subsequent bearish candle following a Spinning Top in an uptrend, or a bullish candle following a Spinning Top in a downtrend. Traders often seek confirmation signals to validate the potential reversal hinted at by a Spinning Top Candlestick. These signals can come in various forms, such as a subsequent bearish or bullish candlestick, other technical indicators like the relative strength index (RSI), or fundamental news events. Confirmation signals help increase the reliability of the potential reversal indicated by a Spinning Top. By seeking additional confirmation, traders can make more informed decisions and increase their likelihood of successful trades. The Long-legged Doji is a variant of the Spinning Top and shares its connotations of market indecision and potential trend reversals. This pattern is characterized by very long upper and lower wicks, and the open and close prices are the same or nearly the same, resulting in an extremely small or nonexistent body. The long wicks indicate a wide range of prices explored during the session, while the identical open and close prices emphasize the balance between buying and selling pressure. Like the Spinning Top, the Long-legged Doji can serve as a warning sign of potential reversals in the market. The Gravestone Doji is another Spinning Top variant, distinguished by a long upper wick and no lower wick, with the open, close, and low prices all at the same level. This pattern signals that buyers pushed prices up during the session, but were unable to sustain these levels, resulting in prices closing where they opened. This failed attempt by buyers to maintain higher prices can suggest that selling pressure is starting to overcome buying pressure, potentially indicating a bearish reversal—especially when the Gravestone Doji appears in an uptrend. Opposite to the Gravestone Doji, the Dragonfly Doji has a long lower wick and no upper wick. The open, close, and high prices are all at the same level. The Dragonfly Doji represents a session where sellers pushed prices down, but buyers managed to push the prices back up to the opening level. The Dragonfly Doji indicates that buying pressure may be starting to exceed selling pressure. Thus, it's often seen as a potential bullish reversal signal, particularly when this pattern appears during a downtrend. The Rickshaw Man Doji, also a Spinning Top variant, has a long upper and lower wick with the open and close prices situated precisely in the middle. This arrangement suggests extreme indecision in the market, with neither buyers nor sellers able to gain the upper hand. Given its strong emphasis on market indecision, the Rickshaw Man Doji, like the basic Spinning Top, can signal potential trend reversals. However, traders usually seek additional confirmation before acting on this signal. Wealth managers and traders can use the Spinning Top Candlestick as a tool to confirm potential trend reversals in the market. When a Spinning Top appears after a prolonged price trend, it could signal a possible trend change, providing an opportunity for traders to adjust their positions accordingly. However, a Spinning Top alone may not provide enough confirmation. Traders often look for further evidence, such as a bearish candle following a Spinning Top in an uptrend or a bullish candle after a Spinning Top in a downtrend. Other technical indicators or fundamental analysis can also provide supportive evidence. Incorporating Spinning Top Candlestick patterns into a trading strategy also offers an opportunity for effective risk management. When a Spinning Top appears, it's a signal of potential change in market sentiment. Traders can use this signal to place stop-loss orders to limit potential losses in case the price moves against their position. For instance, if a Spinning Top forms during an uptrend, a trader might place a stop-loss order just below the low price of the Spinning Top. If the price starts to fall, the stop-loss order will be triggered, limiting the trader's losses. Spinning Top Candlesticks can serve as signals for both trade entry and exit. When a Spinning Top forms at the end of an uptrend, it could serve as a signal to exit long positions or enter short positions, anticipating a potential fall in prices. Conversely, a Spinning Top at the end of a downtrend could signal an opportunity to exit short positions or enter long positions, anticipating a possible rise in prices. However, these signals should not be used in isolation. Traders often use additional technical analysis tools or fundamental analysis to confirm the signals given by the Spinning Top. While the Spinning Top Candlestick provides valuable market insights, it's important to use it in conjunction with other technical indicators. The Spinning Top shows market indecision and hints at potential reversals, but these signals are not always reliable on their own. By using other technical indicators, traders can improve the reliability of the signals and make more informed trading decisions. For example, traders might use momentum indicators like the RSI to confirm a potential reversal signaled by a Spinning Top. If the RSI shows the market is overbought after a Spinning Top forms in an uptrend, it provides additional confirmation of a possible bearish reversal. Like any trading tool, the Spinning Top Candlestick pattern can produce false signals. Sometimes, a Spinning Top may form, indicating potential reversal, but the market continues in its previous trend. This possibility underscores the importance of seeking additional confirmation signals and not relying solely on the Spinning Top. Market volatility can also affect the reliability of the Spinning Top. In highly volatile markets, Spinning Tops can appear frequently, but they might not always signify meaningful reversals. Traders need to be cautious and consider the broader market context when interpreting Spinning Tops. While the Spinning Top Candlestick pattern is a valuable technical analysis tool, it should not be used in isolation from the wider market context. The overall market trend, the occurrence of similar patterns, and the trading volume around the time the Spinning Top forms all influence its interpretation. Additionally, fundamental analysis can provide context that can influence the interpretation of a Spinning Top. For example, upcoming economic events or earnings releases can create market indecision, leading to the formation of Spinning Tops. Traders should consider these fundamental factors when interpreting Spinning Top patterns. A Spinning Top Candlestick is a technical charting pattern that exemplifies a period of indecision in the market. With its distinctive long upper and lower wicks and small body, it visually portrays the tug of war between buyers and sellers during a trading period. The location of the body—whether near the top, middle, or bottom of the range—doesn't significantly impact the pattern's interpretation. What matters is the relatively equal extent of the wicks, signifying the balance of power between the buying and selling forces. The key interpretive value of a Spinning Top Candlestick is its illustration of market indecision. This could potentially forecast an imminent trend reversal, especially when this pattern materializes after a sustained uptrend or downtrend. Traders and investors should seek further confirmation from subsequent candles, or complementary technical indicators, to substantiate the possibility of a trend change. When used appropriately and in combination with other market signals, Spinning Top Candlesticks can be incredibly insightful for market participants.Definition of a Spinning Top Candlestick
Importance of Spinning Top Candlesticks
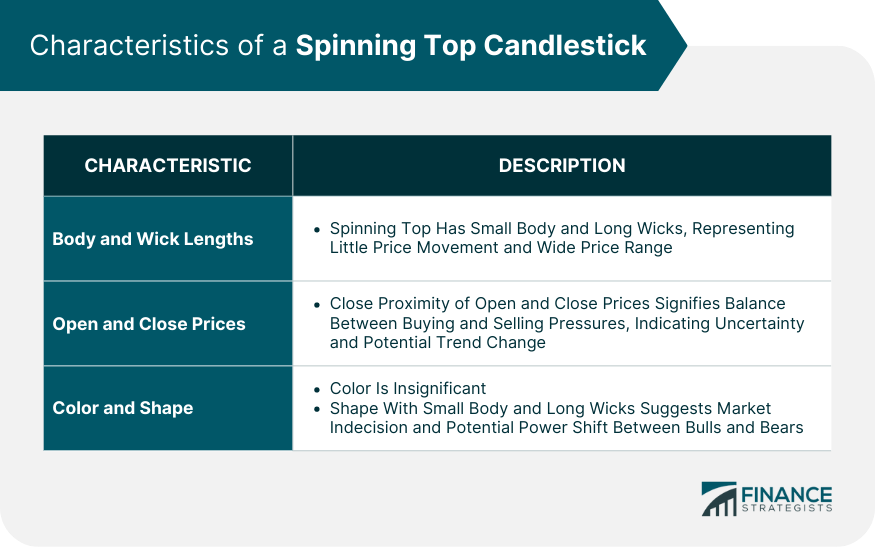
Characteristics of a Spinning Top Candlestick
Body and Wick Lengths
Open and Close Prices
Color and Shape
Interpretation of a Spinning Top Candlestick
Indecision and Market Sentiment
Potential Reversal Patterns
Confirmation Signals
Spinning Top Candlestick Patterns
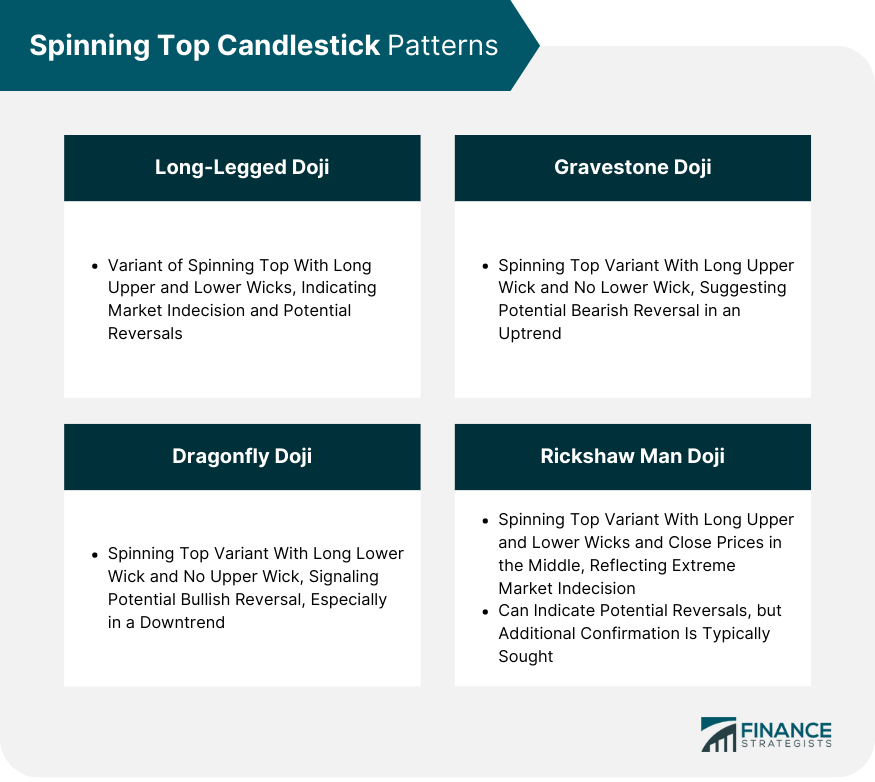
Long-Legged Doji
Gravestone Doji
Dragonfly Doji
Rickshaw Man Doji
Strategies for Incorporating Spinning Top Candlesticks
Trend Reversal Confirmation
Risk Management and Stop Loss Placement
Trade Entry and Exit Signals
Limitations and Considerations in Using Spinning Top Candlesticks
Confirmation With Other Technical Indicators
False Signals and Market Volatility
Market Context and Fundamental Analysis
Conclusion
Spinning Top Candlestick FAQs
A Spinning Top Candlestick is a type of candlestick pattern characterized by a small body situated between long upper and lower wicks. This pattern signals a standoff between buyers and sellers, suggesting market indecision.
A Spinning Top Candlestick indicates a period of indecision in the market. This uncertainty can often precede a reversal in trend, making the Spinning Top a critical tool for anticipating future price movements.
Traders often use the Spinning Top Candlestick to identify potential trend reversals. It can also serve as a risk management tool, guiding the placement of stop-loss orders. However, traders usually seek additional confirmation before acting on signals provided by a Spinning Top.
The Spinning Top Candlestick can produce false signals, and its effectiveness can be influenced by market volatility. Therefore, it's crucial to use it in conjunction with other technical indicators or fundamental analysis.
Yes, a Spinning Top Candlestick can appear in uptrends, downtrends, or sideways trends. However, its significance as a potential reversal signal is strongest when it appears after a prolonged uptrend or downtrend.
True Tamplin is a published author, public speaker, CEO of UpDigital, and founder of Finance Strategists.
True is a Certified Educator in Personal Finance (CEPF®), author of The Handy Financial Ratios Guide, a member of the Society for Advancing Business Editing and Writing, contributes to his financial education site, Finance Strategists, and has spoken to various financial communities such as the CFA Institute, as well as university students like his Alma mater, Biola University, where he received a bachelor of science in business and data analytics.
To learn more about True, visit his personal website or view his author profiles on Amazon, Nasdaq and Forbes.


